Nowcast
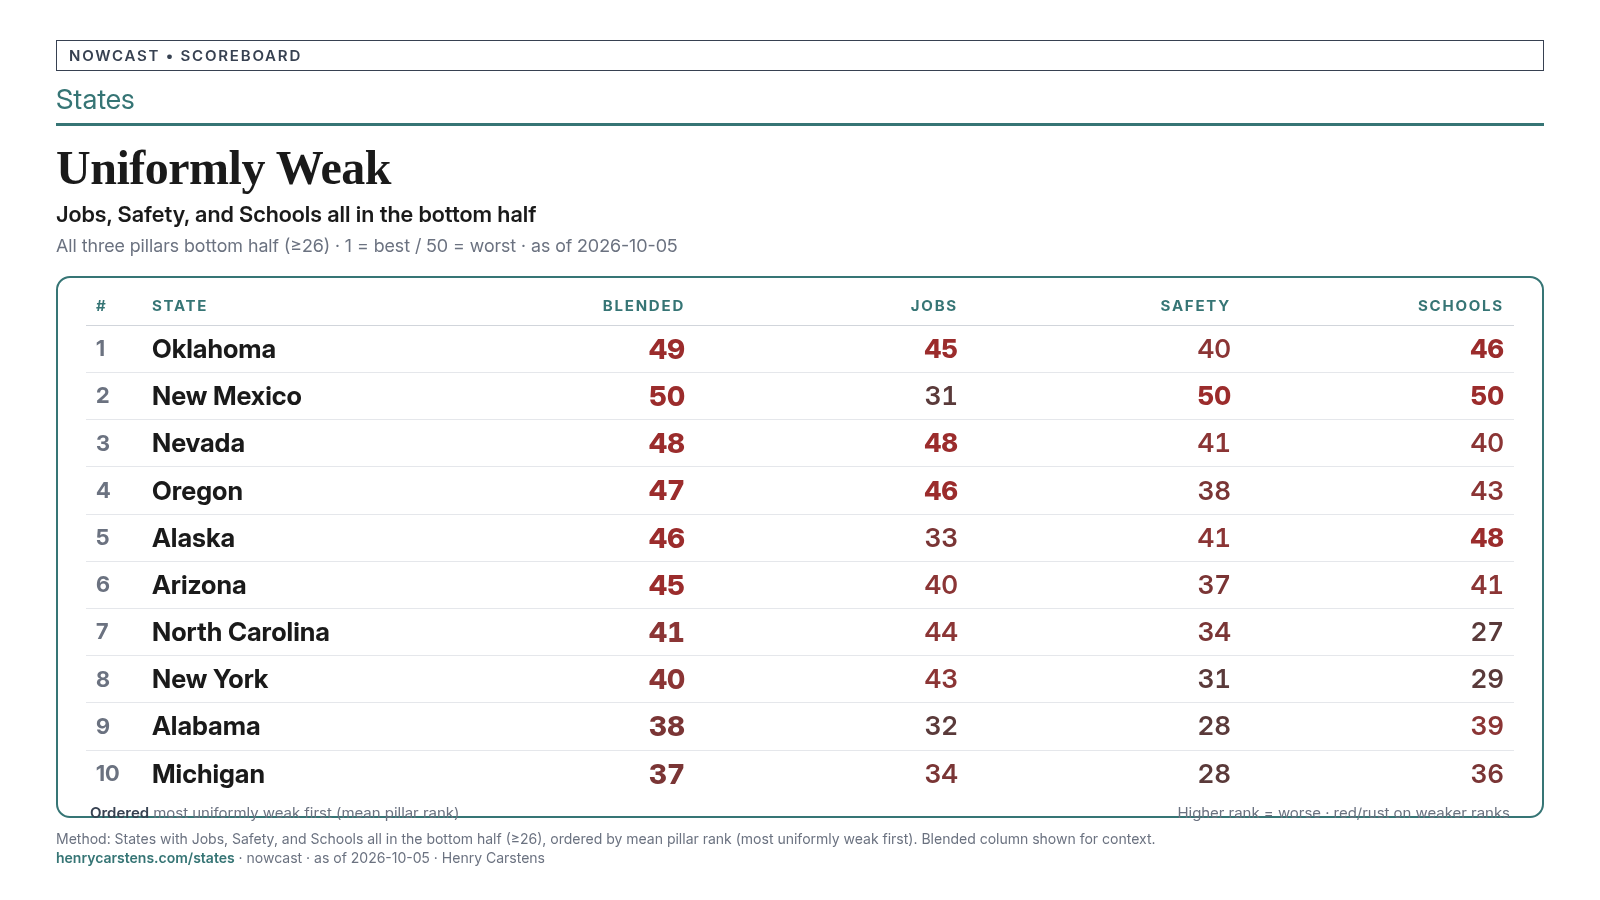
Uniformly Weak 10
Thin Capacity
Ten states sit in the bottom half on jobs, safety, and schools at once. What they share isn't party or unions — it's a thin fiscal base.
Jobs, safety, and schools are a state's operating system. The States nowcast ranks every state on those three pillars. This piece looks at one end of that scoreboard: the Uniformly Weak 10 — states in the bottom half on all three at once.
They are: Oklahoma, New Mexico, Nevada, Oregon, Alaska, Arizona, North Carolina, New York, Alabama, and Michigan.
I compared them with the other 40 states across about sixty structural indicators from Census, BEA, BLS, Pew, FEMA, and related primary sources. The question is simple: what do these ten have in common that the rest of the country doesn't?
The common thread
These ten aren't defined by one region, one labor regime, or one ideology. The shared pattern is fiscal and economic thinness.
1. Higher poverty, lower real income. Nine of the ten have poverty above the other-40 median. Eight have below-median real per-capita income (BEA income adjusted for local prices). Group poverty averages 13.2% versus a 10.9% other-40 median (US 12.1%). Real per-capita income averages $72.8k versus $76.4k.
2. Schools funded more from state and federal money, less from local. Nine of the ten get a below-median share of K-12 revenue from local sources — mostly property taxes. Seven get an above-median federal share. Local share averages 31.1% versus 43.9% for the other 40 (US 43.2%). Nevada (16.3%) and New Mexico (16.7%) sit near the bottom nationally.
Money level isn't the shared trait; money source is. Group per-pupil spending ($17.3k) is basically the same as the other 40 ($17.6k). New York spends the most in the country ($31.9k). Arizona spends $12.0k (#48). Oklahoma is #47.
3. Heavier reliance on federal transfers. Eight of the ten have above-median government transfers as a share of personal income. Eight have an above-median federal share of state general revenue. Transfers average 20.4% of personal income versus 18.2% for the other 40 (US 17.7%). Alaska (#2) and Arizona (#3) are among the most federally dependent state budgets in the country.
Adult attainment runs the same direction: seven of the ten sit below median on high-school completion, and seven below median on bachelor's degrees. Nevada and New Mexico rank #48 and #47 on high-school completion.
Those factors move together. Poverty, transfers, school-finance mix, and attainment are one broad low-capacity cluster with several faces — not four independent causes.
What else shows up
Two more patterns sit under the capacity story.
More diverse populations. Nine of the ten are below the other-40 median on non-Hispanic white share (group mean 56.3% vs. 71.2% median; US 56.3%). The diversity comes from different sources: Hispanic populations in the Southwest, Black populations in Alabama, North Carolina, New York, and Michigan, and Indigenous populations in Alaska, Oklahoma, New Mexico, and Arizona.
That describes who lives in these states. It is not a cause. In US data, composition is tangled up with income, history, rurality, and how crime and test scores get measured. Don't treat it as an explanation by itself.
Western public land and hazard exposure. Five of the ten are among the twelve most federally owned states. Eight have above-median FEMA expected-annual-loss rates. Federal land averages 28.6% of state area versus 4.7% for the other 40. The Indigenous pattern is deep but narrow: four of the seven states with the largest American Indian / Alaska Native shares sit in this group (Alaska #1, New Mexico #2, Oklahoma #4, Arizona #7), along with large tribal, ANCSA, or reservation land bases.
What does not define them
The usual suspects don't separate this group from the other 40.
- Party. Mixed: three Democratic trifectas, two Republican, five divided. Weakness isn't a red-state story or a blue-state story.
- Unions and right-to-work. No pattern. Group union density is 10.6% versus a 9.2% other-40 mean. The group includes New York, the second-most unionized state (21.3%), and North Carolina, the second-least (2.5%). Half are right-to-work; half aren't.
- Per-pupil spending. Flat, as above. Source of school money separates them; level doesn't.
- Cost of living, age, urbanization, growth. All roughly match the other 40. Fast growers (North Carolina, Arizona, Nevada) sit next to slow or shrinking states (New York, Alaska).
Three archetypes inside the ten
No ten-state group is one profile. Fit ranges from nearly complete (New Mexico, Arizona) down to thin (New York). Roughly three shapes:
- Indigenous / resource / public-land West (strongest fit): New Mexico, Alaska, Oklahoma, Arizona, plus Nevada and Oregon on land and school finance. High Indigenous share or federal land, oil- or government-heavy economies, thin local school tax base.
- Thin-public-sector Sun Belt growers: Arizona, Nevada, North Carolina. Fast growth, low per-pupil spend, low union density — growth that hasn't translated into pillar strength.
- Legacy high-capacity states with a different problem: New York, Michigan, and partly Oregon. Higher spending, more unionized, lower hazard. They share the poverty/transfers core and little else. Alabama is a Deep South variant of the low-capacity core.
New York fits the structural profile least. Rich, highly unionized, the top K-12 spender, low hazard, schools funded locally (50.9%). Its weakness looks like inequality (high poverty next to high income), population loss, and a weak Jobs reading — a separate case.
Oregon is half a fit. Well educated, unionized (15.1%), high-cost. It shares poverty, transfers, and a below-median local school share, but its Jobs rank is doing a lot of the work. In Oregon, cost and jobs look like the questions, more than capacity.
Oklahoma is the archetype: high poverty, oil-cyclical, Indigenous-jurisdiction complexity, very low K-12 spend (#47), weak on all three pillars from low capacity rather than from one swinging policy.
What this does and doesn't say
- Correlation isn't causation. These are 50 state-level associations. The capacity factors move together. Nothing here proves that shifting school funding toward local sources would raise a state's ranks.
- Schools is partly circular. Test scores track poverty, transfers, and adult education everywhere. Part of the Schools pattern is the pillar measuring the same thing again.
- The pattern explains Safety and Schools more than Jobs. Jobs barely correlates with any structural factor across the 50 states. Weak Jobs scores in this group look more cyclical or idiosyncratic than structural.
- Small group. With ten states, one swap moves the counts. Treat the three archetypes as more useful than a single label.
Close
The story people expect — that uniformly weak states share a party, a labor regime, or a spending level — doesn't hold. What holds is quieter: higher poverty, more transfer dependence, and school systems that lean on state and federal money instead of a local tax base. That's thin capacity, not a single ideology.
That doesn't tell any state what to do. It does tell you where the scoreboard is pointing.
See where your state sits: https://www.henrycarstens.com/states
— Henry
Method. Group means are unweighted. "Median" means the other-40 median. Real income = BEA 2025 per-capita personal income ÷ BEA 2024 regional price parity. Sources: Census ACS 2024 1-year; Census Annual Survey of School System Finances FY2024; BEA SAINC/SARPP/SAGDP; Pew FY2024 state revenue shares; BLS Union Members 2025; NCSL; Ballotpedia (Oct 2026); FEMA NRI v1.20; CRS R42346. Full tables and per-state matrix in the companion study.