Migration
Since 2020, Movers Went Where It's Cheaper, Not Where Schools or Safety Rank Best
Since 2020, net migration between states has lined up with prices and taxes. It hasn't lined up with schools or safety. We built two rankings of "cheap." One tracks the moves and one doesn't, and part of the reason is how the second one is built.
Correction, Oct 9, 2026: clarified that 22nd/30th/39th are overall ranks with pooled Jobs, not Jobs ranks.
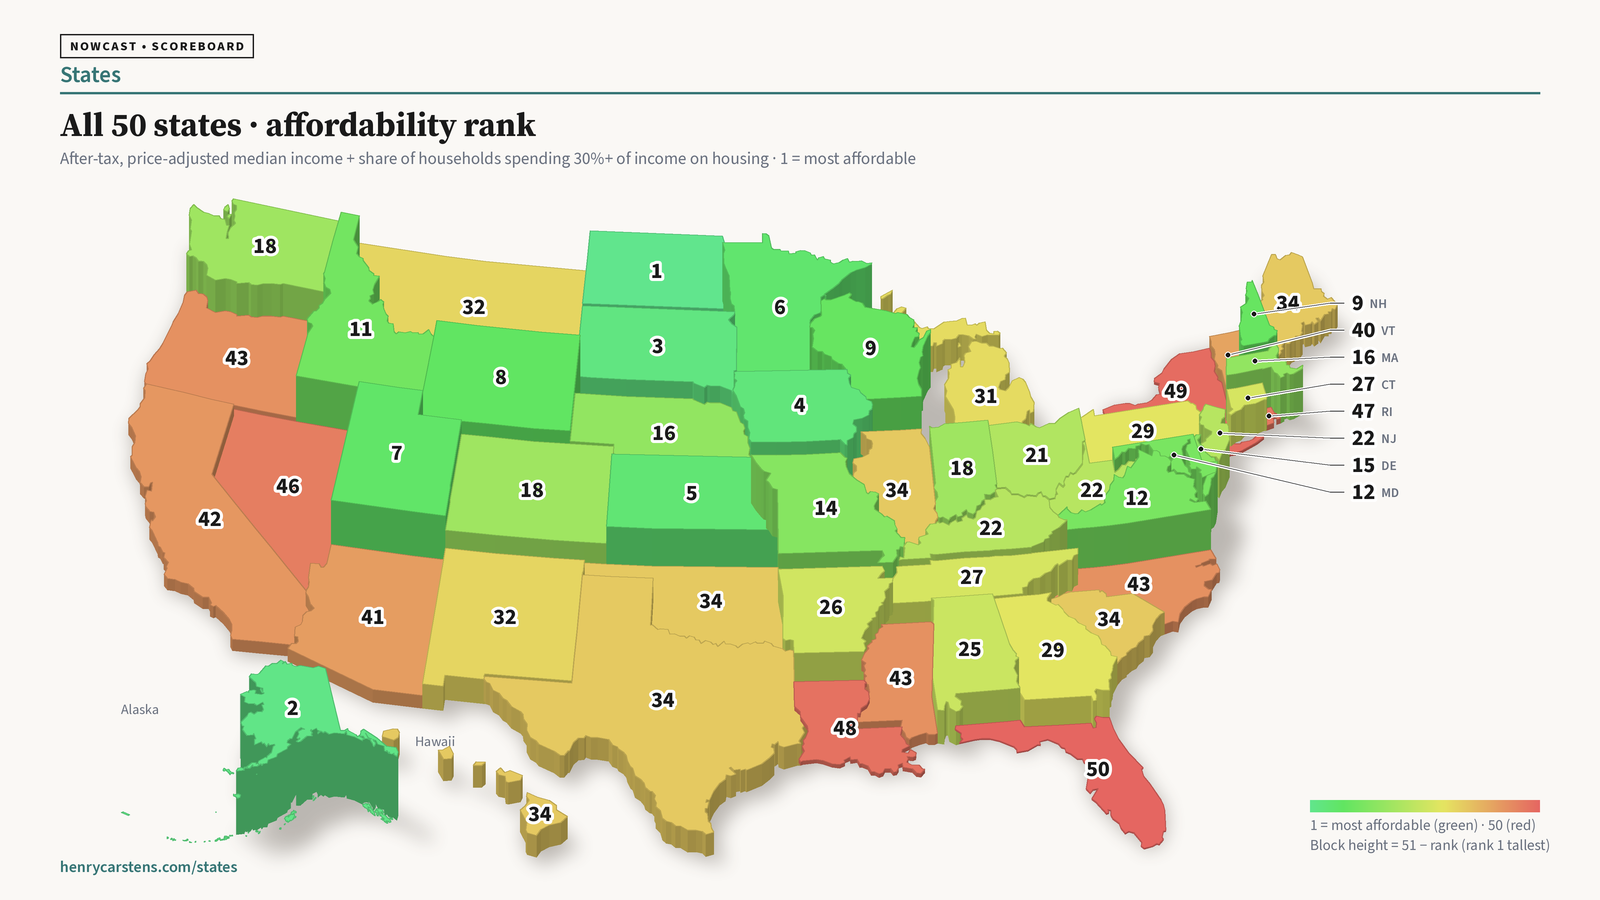
Our States map ranks every state on Jobs, Safety, and Schools. A fair question is whether people's moves line up with those things. Since 2020, mostly they don't.
Where people went
From mid-2020 to mid-2025, South Carolina and Idaho each gained about 71 net domestic movers per 1,000 residents. Montana, Delaware, North Carolina, Maine, and Tennessee gained 40 or more. New York lost 52 per 1,000, California 41, and Hawaii 38.
Those moves don't follow our blended rank. Tennessee and Oklahoma are in our bottom 10 and both gained movers. New Jersey is 1st on our map and lost them.
Not schools. Not safety.
We lined up net domestic migration against each pillar. The correlation is −0.01 with Safety and +0.12 with Schools, and neither is significant. Adding prices, taxes, and winter weather doesn't change that. The result holds in Census and IRS data, before and after 2020. One check using survey data is borderline for Safety.
That doesn't mean families ignore schools and crime. Research suggests they act on them close to home, by choosing a district or a safer town in the same metro area (for example, Cullen and Levitt on crime; Black on school districts). A state average is too blunt to show that.
Two rankings of "cheap"
Affordability rank asks how a typical household is doing. It blends two ranks: median household income after state and local taxes and adjusted for local prices, and the share of households spending 30% or more of income on housing.
Cost rank asks only what things cost. It blends two ranks: the local price level and the state and local tax burden.
For both, 1 is the best and 50 the worst. The two agree less than you'd expect: their correlation is +0.14.
Affordability, most to least: North Dakota 1, Alaska 2, South Dakota 3, Iowa 4, Kansas 5 … New York 49, Florida 50.
Cost, cheapest to most expensive: South Dakota 1, Oklahoma 2, North Dakota 3, Louisiana 4, Tennessee 5 … California 48, Hawaii and New York tied at 49.
Oregon is tied for 43rd on affordability, with Mississippi and North Carolina, and 37th on cost. It is 24th on after-tax, price-adjusted income but 41st on housing burden, and its prices are above the national average.
Which one tracks the moves?
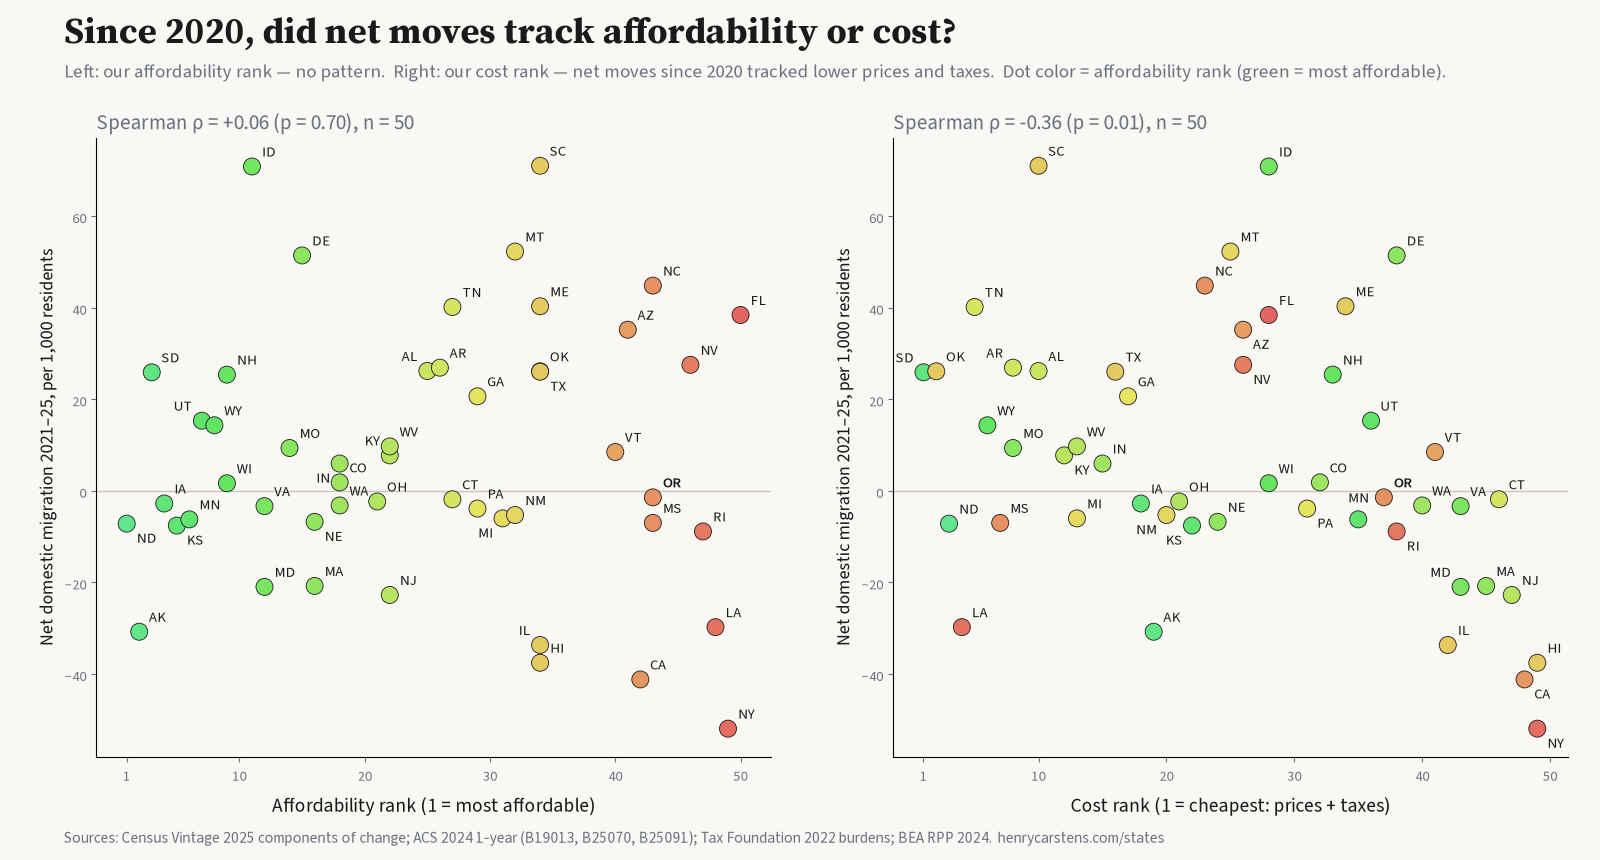
- Cost rank: correlation −0.36 with net migration in 2021–25, and −0.46 in the latest year. Cheaper states gained more people. The range of plausible values is wide, from −0.62 to −0.06, but the link holds after adding Safety, Schools, and weather. It shows up only since 2020. Before 2020 it was weak and not significant (−0.14).
- Affordability rank: correlation +0.06, with no pattern. Put both ranks in one model and cost carries the signal.
We also measured cost before the moves. Moves raise prices: fast-growing states' price levels climbed faster after 2020. Florida went from 99.6 to 103.4 on the national price index. So we rebuilt the cost rank from 2019 prices and taxes, before the moves. The link got stronger: correlation −0.46, and −0.49 in the model with Safety, Schools, and weather. Those 2019 numbers are closest to what a mover would have seen.
Why doesn't affordability track the moves? Mostly because of how it's built. It already contains prices and taxes, pulling in opposite directions:
- The income half rises with cost. Expensive states pay more, even after adjusting for prices. Seven of the 10 states with the highest after-tax, price-adjusted income lost movers. Colorado, New Hampshire, and Utah gained. The overall link is weak and not statistically significant.
- The housing half falls with cost. Expensive states have more households paying 30% or more of income on housing.
- The two halves mostly cancel.
Florida isn't last because people moved there. It was already last on affordability in 2019, before the moves.
Business openings tend to follow
The one pillar that moves with migration is Jobs: business openings minus closings. Migration in one year tends to come before more openings the next year (p ≈ 0.02 after correcting for a quirk in the 2024 BLS data). The reverse link is weaker and not significant once each state's own migration trend is taken into account. New residents likely need dentists, contractors, and coffee shops.
That's a caution about our own Jobs pillar: part of it may measure who moved in. The 2024 BLS data also booked many closings late in several fast-growing states, so we don't lean on 2024 Jobs ranks here. That quirk also puts North Carolina, Arizona, and Nevada in our current bottom 10. On the overall map with 2023–24 Jobs pooled, North Carolina ranks 22nd, Arizona 30th and Nevada 39th. Their 2024 Jobs ranks (44th, 40th, 48th) reflect a BLS timing quirk; pooled, their Jobs ranks are 12th, 3rd and 15th.
What it means
- For states: since 2020, lower prices and taxes have tracked the moves more closely than anything on our map. Our opinion, not tested here: housing supply is the lever to watch, because arrivals push prices up.
- For schools and safety: they may matter on a slower clock, for who stays and how a state does over a decade. We didn't test that here.
- For Oregon: it was a top-five destination in 2016–19 and is about flat now. That is narrowly the biggest drop of any state, just ahead of Washington and Nevada. We found no state-level evidence that its Schools or Safety ranks drove the drop.
Since 2020, moves have lined up with lower bills, and business openings tend to follow. Schools and safety didn't show up in the moving numbers.
All 50 states
Ranks are 1 to 50, with ties sharing a rank. Net migration is net domestic moves per 1,000 residents, July 2020 to July 2025.
| State | Affordability rank | Cost rank | Net migration per 1,000, 2021–25 |
|---|---|---|---|
| North Dakota | 1 | 3 | −7.2 |
| Alaska | 2 | 19 | −30.8 |
| South Dakota | 3 | 1 | +25.9 |
| Iowa | 4 | 18 | −2.8 |
| Kansas | 5 | 22 | −7.6 |
| Minnesota | 6 | 35 | −6.3 |
| Utah | 7 | 36 | +15.3 |
| Wyoming | 8 | 6 | +14.3 |
| New Hampshire | 9 | 33 | +25.4 |
| Wisconsin | 9 | 28 | +1.6 |
| Idaho | 11 | 28 | +70.8 |
| Maryland | 12 | 43 | −21.0 |
| Virginia | 12 | 43 | −3.4 |
| Missouri | 14 | 8 | +9.3 |
| Delaware | 15 | 38 | +51.4 |
| Massachusetts | 16 | 45 | −20.8 |
| Nebraska | 16 | 24 | −6.8 |
| Colorado | 18 | 32 | +1.8 |
| Indiana | 18 | 15 | +5.9 |
| Washington | 18 | 40 | −3.2 |
| Ohio | 21 | 21 | −2.4 |
| Kentucky | 22 | 12 | +7.7 |
| New Jersey | 22 | 47 | −22.8 |
| West Virginia | 22 | 13 | +9.7 |
| Alabama | 25 | 10 | +26.2 |
| Arkansas | 26 | 8 | +26.9 |
| Connecticut | 27 | 46 | −1.9 |
| Tennessee | 27 | 5 | +40.1 |
| Georgia | 29 | 17 | +20.6 |
| Pennsylvania | 29 | 31 | −3.9 |
| Michigan | 31 | 13 | −6.0 |
| Montana | 32 | 25 | +52.2 |
| New Mexico | 32 | 20 | −5.3 |
| Hawaii | 34 | 49 | −37.6 |
| Illinois | 34 | 42 | −33.7 |
| Maine | 34 | 34 | +40.3 |
| Oklahoma | 34 | 2 | +26.1 |
| South Carolina | 34 | 10 | +71.0 |
| Texas | 34 | 16 | +26.0 |
| Vermont | 40 | 41 | +8.5 |
| Arizona | 41 | 26 | +35.2 |
| California | 42 | 48 | −41.2 |
| Mississippi | 43 | 7 | −7.0 |
| North Carolina | 43 | 23 | +44.8 |
| Oregon | 43 | 37 | −1.4 |
| Nevada | 46 | 26 | +27.5 |
| Rhode Island | 47 | 38 | −8.9 |
| Louisiana | 48 | 4 | −29.8 |
| New York | 49 | 49 | −52.0 |
| Florida | 50 | 28 | +38.4 |
See where your state sits: https://www.henrycarstens.com/states
--h
Method.
- Affordability rank: the mean of two ranks, left unrounded, then ranked 1–50. (a) ACS 2024 1-year median household income × (1 − Tax Foundation 2022 state-local tax burden) ÷ BEA RPP 2024. (b) The share of renter and owner households paying 30%+ of income on housing (ACS 2024 B25070, B25091).
- Cost rank: the mean of the rank of BEA RPP 2024 (all items) and the rank of the Tax Foundation 2022 burden.
- Order and ties: the cost rank was built second, after the affordability rank showed no link to migration. Earlier work had already found prices and taxes predictive, and the 2019-input test is strong enough to survive a correction for the many tests we ran. Ties share the better rank. With average-rank ties, six cost ranks move by one place.
- Inputs: ACS 2024 is the latest year; the 2025 release is postponed. The Tax Foundation burden is a share of state net product, not a household tax rate.
- 2019 check: ACS 2019, BEA RPP 2019, and Tax Foundation 2019.
- Migration: Census Vintage 2025 net domestic migration, per 1,000 residents in 2020. Correlations are Spearman, n = 50. The range for the cost correlation is a bootstrap 95% interval. Controlled models are OLS on standardized variables with robust errors.
- Business openings: timing comes from a 2016–24 state panel with state and year fixed effects.
- These are state-level correlations, not proof of cause, and not evidence about any single mover's reasons.