Oregon
Who Is Oregon Losing?
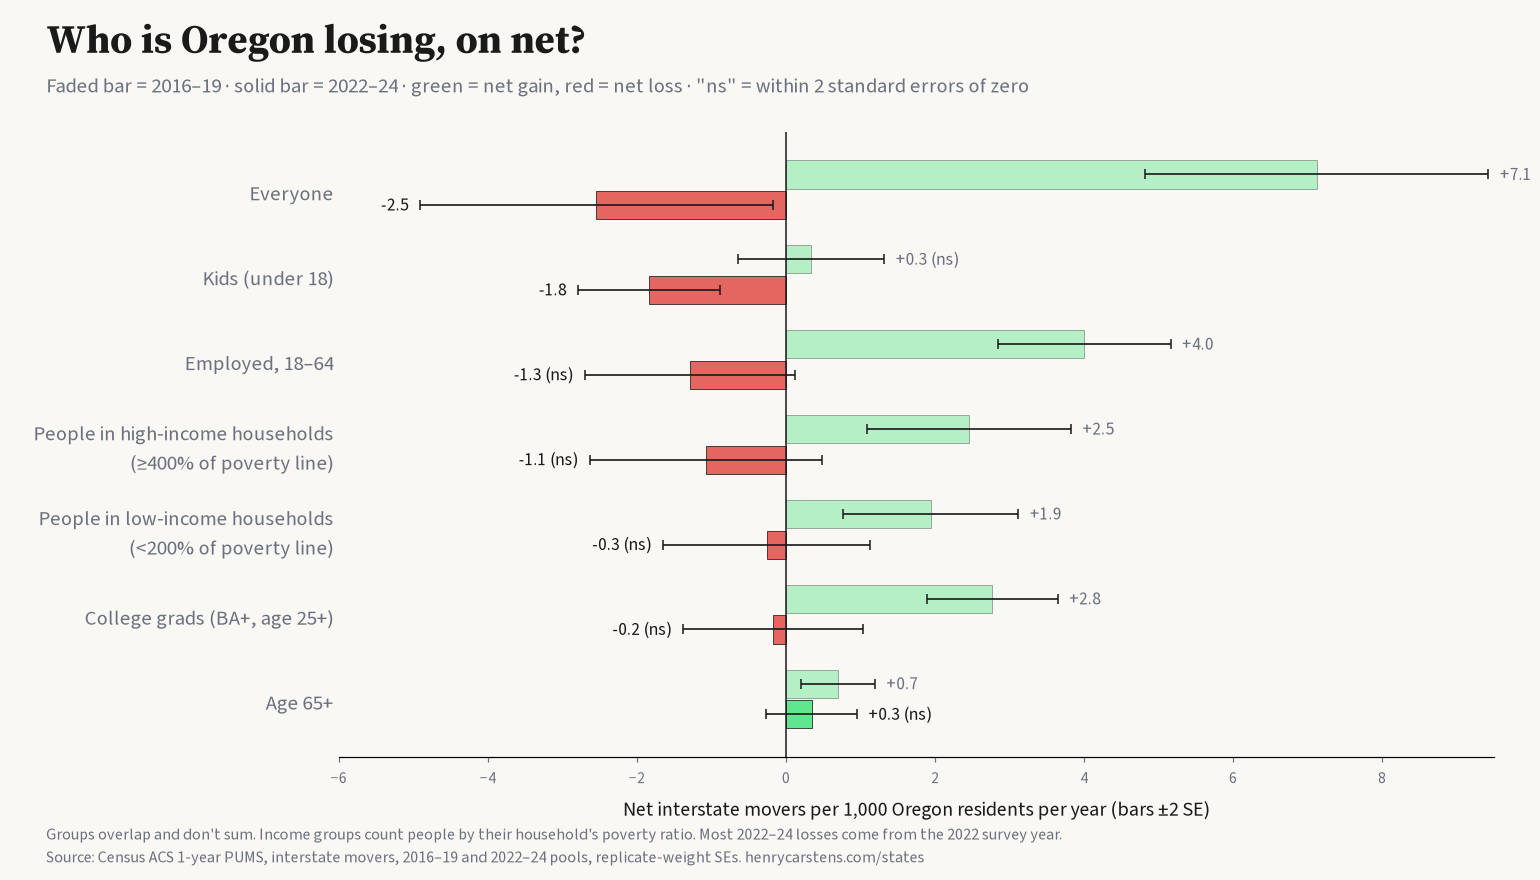
Before 2020, Oregon gained movers in every income and education group. In 2022–24 it lost more people to other states than it gained. On net, the clearest loss is children, not the poorest.
From 2016 to 2019, Oregon had the fifth-highest rate of net domestic in-migration of any state: about 8.5 movers per 1,000 residents a year (Census Bureau estimates, Vintage 2020). Census estimates now put Oregon close to flat. In 2022–24 it lost about 1.4 net domestic movers per 1,000 residents a year (Vintage 2025), and early estimates for 2025 show a slight gain (+0.5). Tax records show a similar loss: about 1.7 per 1,000 a year for 2020–23. The Census Bureau's American Community Survey, which we use below to see who moves, shows a larger loss for 2022–24, about 2.5 per 1,000 a year. But that is a sample estimate with a wide margin, roughly 0.2 to 4.9, and most of it comes from the 2022 survey alone. Either way, the turn is sharp: no state's rate fell further from the late 2010s.
Before 2020: gains across income and education
In 2016–19, Oregon gained people in high-income and low-income households, college graduates, and working adults with jobs. Each of those gains was clearly above zero. Children were about even.
Since 2020: the clearest loss is children
In 2022–24, children under 18 are the clearest net loss: −1.8 per 1,000 residents a year, nearly four standard errors from zero. Most of that loss falls in the 2022 survey year. It is smaller in 2023 and not significant in 2024. Adults 65 and older were about even (+0.3, not significant).
The other groups lean negative, but none is clearly different from zero:
- People in high-income households: −1.1
- Working adults with jobs: −1.3
- People in low-income households: −0.3
- College graduates 25 and older: −0.2
Tax records point the same way. In 2020–23, tax returns leaving Oregon listed slightly more people than returns arriving: 1.67 against 1.57. That fits more children among leavers. (The IRS changed how it counts people on a return in 2018, so we don't compare this with earlier years.)
Per return, leavers reported more income: about $83,300 in adjusted gross income against $78,000 for arrivals. Per person, incomes were about the same, close to $50,000 on both sides, because leavers' returns covered more people. Tax records miss people who don't file, and income is counted after the move.
Who it's not
We see no net loss of low-income residents. About 15% of movers in each direction are below the poverty line (15.4% in, 15.1% out), and the gap isn't significant. Migration isn't measurably changing Oregon's poverty rate.
What lines up with it
Oregon ranks 37th on our cost rank, which is built from prices and taxes. It is tied for 43rd on affordability, and 41st on the share of households paying 30% or more of income on housing. Since 2020, cost has tracked moves between states more closely than our Schools or Safety ranks. That is a correlation. It doesn't tell us why any family left.
Portland's high-earner tax is often blamed. One study of Multnomah County's Preschool for All tax found more high-income households moving out after it began. Most of them went to neighboring counties. The authors call their estimate an upper bound, partly because the tax arrived alongside the pandemic and other changes (Conway, Iselin & Rork, 2026). An analysis from a Portland city councilor's office disputes the finding. Treat the tax evidence as contested.
For how long Oregon's ranks may take to climb back, see How long will it take Oregon to recover?
--h
Method.
- Census: net domestic migration from Population Estimates Vintage 2020 (2016–19) and Vintage 2025 (2022–24 and 2025; 2025 is provisional).
- Tax records: IRS state-to-state migration data, filers and dependents, 2020–23.
- Groups: ACS 1-year microdata, interstate movers only, pooled 2016–19 and 2022–24 (2020 skipped). Values are per 1,000 Oregon residents per year. Error bars and "clearly different from zero" use ±2 standard errors from replicate weights.
- Group definitions: income groups count people by their household's poverty ratio. College graduates are age 25 and older. Groups overlap and don't sum.
- Measurement: out-movers are measured in their new state, and income covers the past 12 months.
- IRS figures: income per return and per person are adjusted gross income.
- These are correlations, not causes.