Nowcast
Bottom 10
How long until the bottom 10 get back up?
About two years to climb out once. About four to be out two years running. About 1 in 3 reach the middle within six years. Schools is the slow pillar.
The bottom 10 are the ten states with the lowest blended rank on 2024 data: Colorado, Tennessee, North Carolina, Washington, Arizona, Alaska, Oregon, Nevada, Oklahoma, and New Mexico. The blended rank averages a state's Jobs, Safety, and Schools ranks. 1 is the healthiest. 50 is the least healthy.
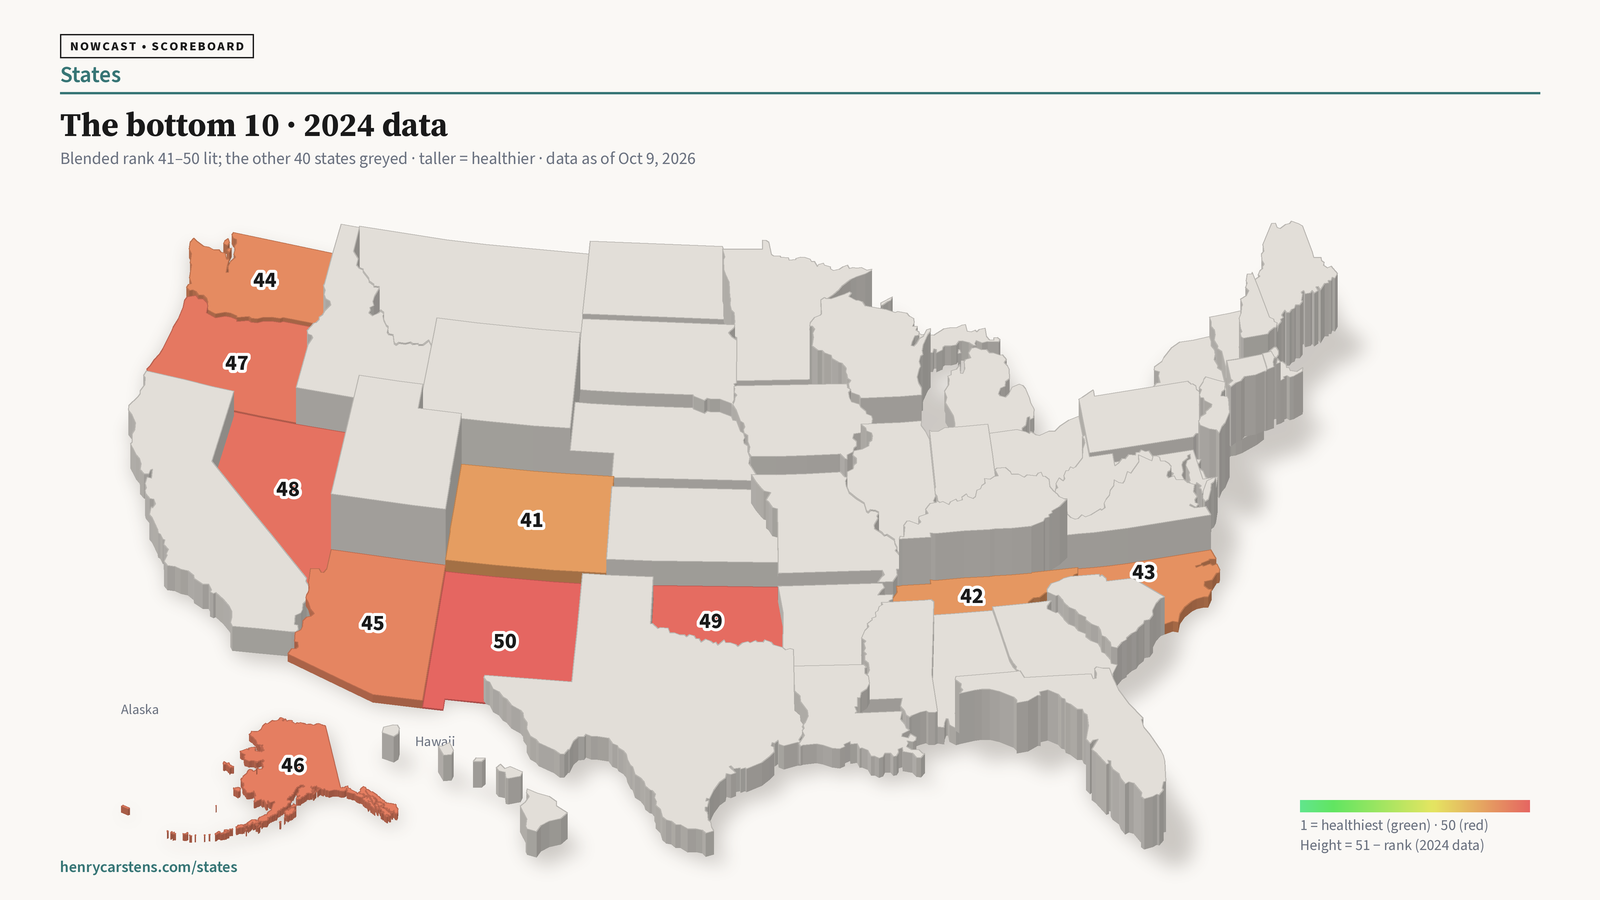
How long until they get back up? We did not guess. We rebuilt the blended rank for every year from 2016 to 2024 with the same three sources and the same rules as the map. Our 2024 rebuild matches the live map for all 50 states. Then we counted what happened to states that landed in the bottom 10. What follows is a base rate from the past, not a forecast.
Three ways to get back up
- Out. The state reaches 40th or better at least once.
- Out two years running. The state is 40th or better two years in a row.
- The middle. The state reaches 25th or better.
From 2016 to 2023, a state sat in the bottom 10 in a given year 80 times. Those 80 cases come from 21 states, and a few states count many times: Alaska, Louisiana, and New Mexico are 8 each. Here is how often a state got back up, counting from that year.
| Within | Out | Two years running | The middle |
|---|---|---|---|
| 1 year | 30% | 19% | 7% |
| 2 years | 49% | 32% | 15% |
| 4 years | 70% | 52% | 25% |
| 6 years | 83% | 63% | 36% |
So the typical answer is about two years to get out once, and about four to be out two years running.
Two years running is not the same as staying out. Of the 12 states that cleared that bar after first landing in the bottom 10, 5 later fell back in: Oklahoma, South Carolina, Washington, Missouri, and New York.
The middle is rarer. About 1 in 3 to 4 in 10 get there within six years: 36% of the cases above, 4 of the 10 states in 2016's bottom 10, and 8 of the 21 states that were ever in the bottom 10 in these years. After six years the data run out.
The class of 2016
The ten lowest states in 2016 are the only group we can watch for the full eight years.
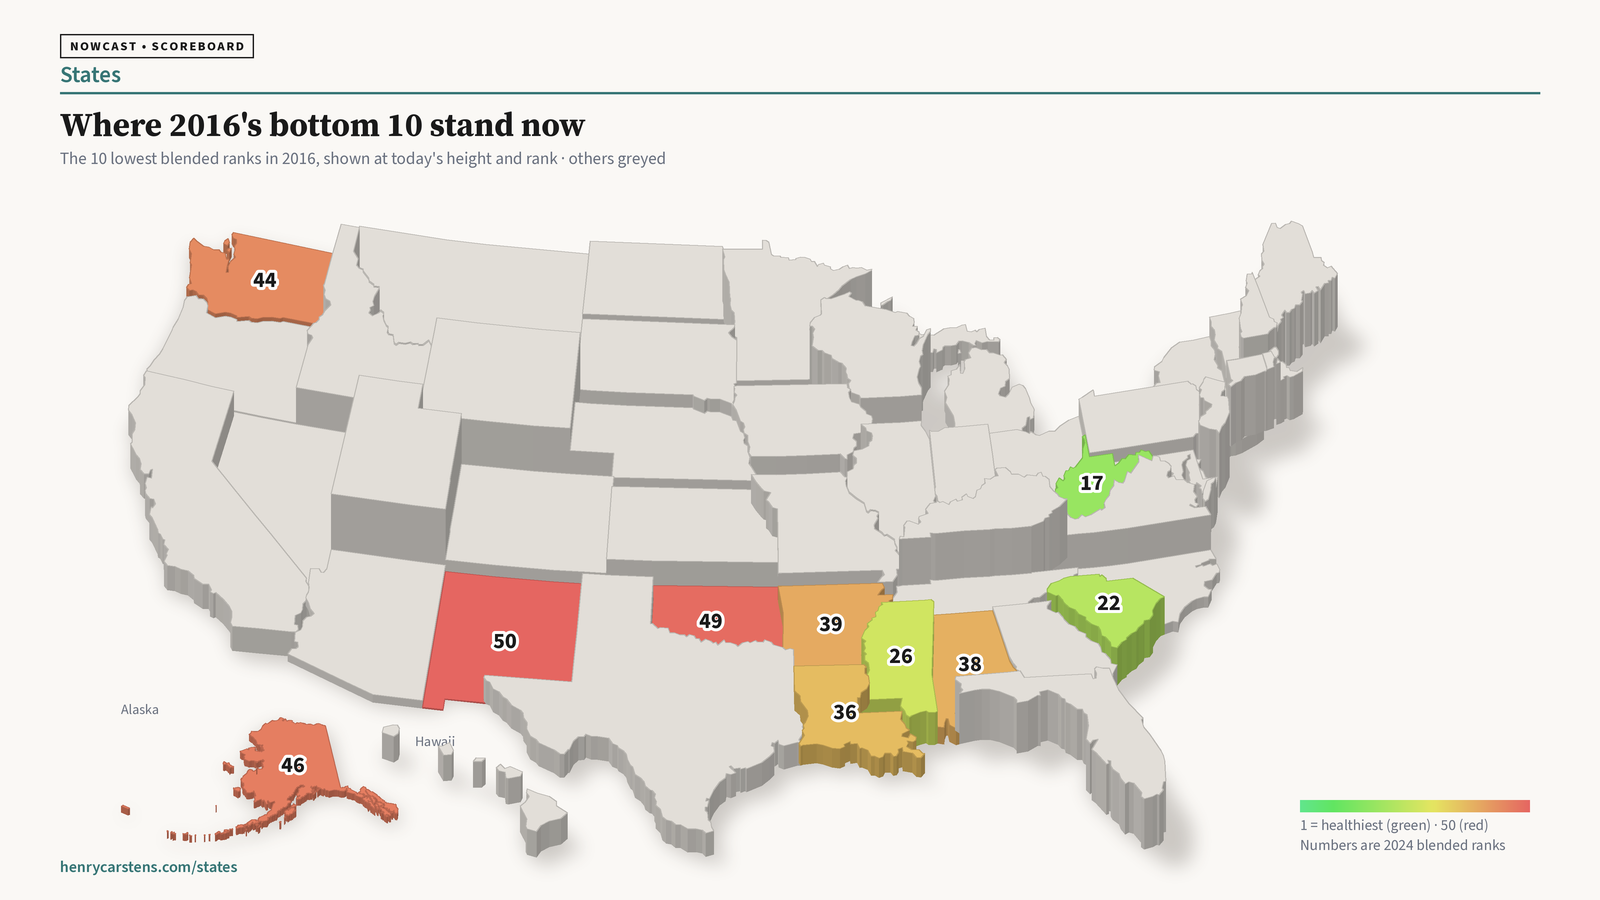
| State | 2016 | 2024 | Since first getting out |
|---|---|---|---|
| West Virginia | 43 | 17 | Out every year since 2020 |
| South Carolina | 42 | 22 | Fell back in once |
| Mississippi | 44 | 26 | Out every year since 2020 |
| Louisiana | 50 | 36 | First out in 2024 |
| Alabama | 45 | 38 | Out every year since 2021 |
| Arkansas | 47 | 39 | Fell back in once |
| Washington | 41 | 44 | Back in since 2022 |
| Oklahoma | 46 | 49 | Back in since 2024 |
| Alaska | 49 | 46 | Never out |
| New Mexico | 48 | 50 | Never out |
Eight of the ten got out at least once. Four reached the middle at some point: Washington, West Virginia, South Carolina, and Alabama. West Virginia and Mississippi have stayed out every year since 2020, and Alabama since 2021.
Louisiana got out in 2024 on gains in Schools (43rd to 34th) and Jobs (31st to 21st). The 2024 FBI numbers cover only 80% of Louisiana's population. The rates here are adjusted for that, so its Safety rank (46th) does not get credit for the missing reports.
The group's average rank went from 45.5 to 36.7. Don't read that as a climb rate. Any group picked for one extreme year drifts toward the middle later. The 2016 top 10 fell from an average of 5.4 to 17.1 over the same years, a bigger move.
This is also a ranking, so someone has to fall for someone to climb. On average, 7 of each year's bottom 10 were still there the next year.
Why: three pillars, three speeds
The three pillars move at very different speeds. The measure below is how much a state's rank predicts its rank later. 1.0 means the order never changes. 0 means the earlier rank tells you nothing.
| Pillar | Next reading | Longest gap | Typical move |
|---|---|---|---|
| Jobs | 0.45 (0.10–0.70) | 0.02 over 8 years | 7 places a year |
| Safety | 0.97 | 0.80 over 8 years | 1 to 2 places a year |
| Schools | 0.95 (0.88–0.97) | 0.59 over 21 years | About 2 places per test |
Jobs is a flow: businesses opened minus businesses closed in one year. It swings hard and snaps back. States in the Jobs bottom 10 sit at a median of 38th the next year.
Safety and Schools are stocks. A crime rate rests on police, courts, neighborhoods, and habits that change slowly. A grade 8 test score reflects eight years of school. A good Jobs year can lift a state stuck on those pillars. A bad one can drop it back.
One caution. NAEP is given every two or three years, so between tests the Schools rank stays put. That makes the blended rank look steadier from year to year than it is: 0.83 for the blend, 0.69 for Jobs and Safety alone.
Two kinds of bottom-10 state
Pushed in by jobs or safety: Colorado, Tennessee, North Carolina, Washington. Their Schools ranks are 7, 16, 28, and 21. Each sits within a few places of the line. Holding the rest at 2024, Colorado gets out with a Jobs rank of 45 instead of 47, and North Carolina with 41 instead of 44. In the past, states like these got out 9 times in 16 within a year. Five of 12 were out two years running within a year. After that there are too few cases to say. Colorado and Tennessee also carry Safety ranks of 47 and 45, and that pillar moves slowly.
Held down by schools: Arizona, Alaska, Oregon, Nevada, Oklahoma, New Mexico. Their Schools ranks run from 42 to 50. To get out on Jobs alone, Arizona would need 25th on Jobs. Oregon would need 22nd, Nevada 21st, Oklahoma 18th, Alaska 14th, and New Mexico 2nd. In the past, states like these were out two years running 49% of the time within four years and 56% within five. They reached the middle 23% of the time within four years and 36% within six.
If the ten match the past, most of the first four would likely get out within two years, though Jobs can move 7 places either way in a year. About half of the other six would be out two years running in four to five years. About two would reach the middle within six.
The big Schools climbs
Schools is the slow pillar, but some states have climbed a long way. Among the largest climbs since 2003: Utah went from 30th in 2009 to 2nd in 2022. Hawaii went from 41st in 2011 to 18th in 2024, and 22 of those places came after 2019. Tennessee went from 44th in 2011 to 16th. Mississippi went from 50th in 2013 to 26th. Louisiana went from 49th in 2017 to 34th. Those took 7 to 13 years.
Two cautions. Before NAEP tightened its rules on excluding students in 2010, states differed a lot in who sat the test, so early ranks are less comparable. And Mississippi's grade 4 gains came alongside a third-grade reading retention law, which changes who takes the grade 4 test.
A note on crime data
FBI counts come only from the agencies that report. Divided by the whole state's population, crime looks lower than it is where many agencies don't report. So the map, and every year here, divides by the population the reporting agencies cover. In 2024 that matters most for Mississippi (64% of the population covered), Louisiana (80%), Florida (81%), and Indiana (88%). The adjustment moved Mississippi from 17th to 26th and Florida from 7th to 12th. It did not change which states are in the bottom 10.
Close
A bottom-10 state can get out in a year on a good Jobs number, and Jobs can drop it back just as fast. Safety and Schools move slowly. That is why the states held down by Schools stay longest.
See where your state sits: https://www.henrycarstens.com/states
--h
Method. We rebuilt the blended rank for 2016–2024 from the map's own sources and rules. Jobs: BLS BED NSA establishment births minus deaths over QCEW annual-average private establishments, ranked. Safety: FBI CDE violent and property rates per 100,000, adjusted for reporting coverage (reported offenses over the population the reporting agencies cover), each ranked lowest-first, then averaged. Schools: the mean of the four NAEP grade ranks (grade 4 and 8, reading and math) from the most recent test at or before that year. Blend = (Jobs + Safety + Schools) / 3, unrounded, ranked, ties shared. Our 2024 matches the live map for all 50 states. For 2016–2023, a state-year with FBI December coverage under 90% also has its crime rates filled in from the nearest years that are 90% or better. That is 42 of 400 state-years, 15 of them in 2021. States that never reach 90% (Mississippi, Indiana, West Virginia) and all 2024 rows keep their coverage-adjusted rates, as on the live map. Shares use a Kaplan-Meier estimate over 80 state-years from 21 states, which counts cases not yet watched long enough. "Two years running" can only be confirmed through 2023. Counting one case per state, or only new entries, moves the shares by up to about 10 points, mostly upward, and the two-year answer for getting out holds. The "pushed in" and "held down" groups use a Schools rank of 35 or better versus 36 or worse in the year a state entered the bottom 10. Jobs ranks needed to get out hold the other 49 states and the state's other two pillars at 2024. Schools long-run figures use NAEP 2003–2024; NAEP's 2010 inclusion rules mean pre-2010 ranks are less comparable. This is a base rate from the past, not a forecast. It does not change the ranks or the map.