Nowcast
Oregon
How long will it take Oregon to recover?
Oregon ranked 24th to 33rd from 2016 to 2019. It is 47th now. One good Jobs year could lift it out of the bottom 10. Getting back near its 2016–19 average would take Schools and Safety climbs that few low-ranked states have made.
Oregon is 47th of 50 on the blended rank, on 2024 data. Its pillar ranks are Jobs 46th, Safety 37th, and Schools 45th. The blended rank averages those three. 1 is the healthiest.
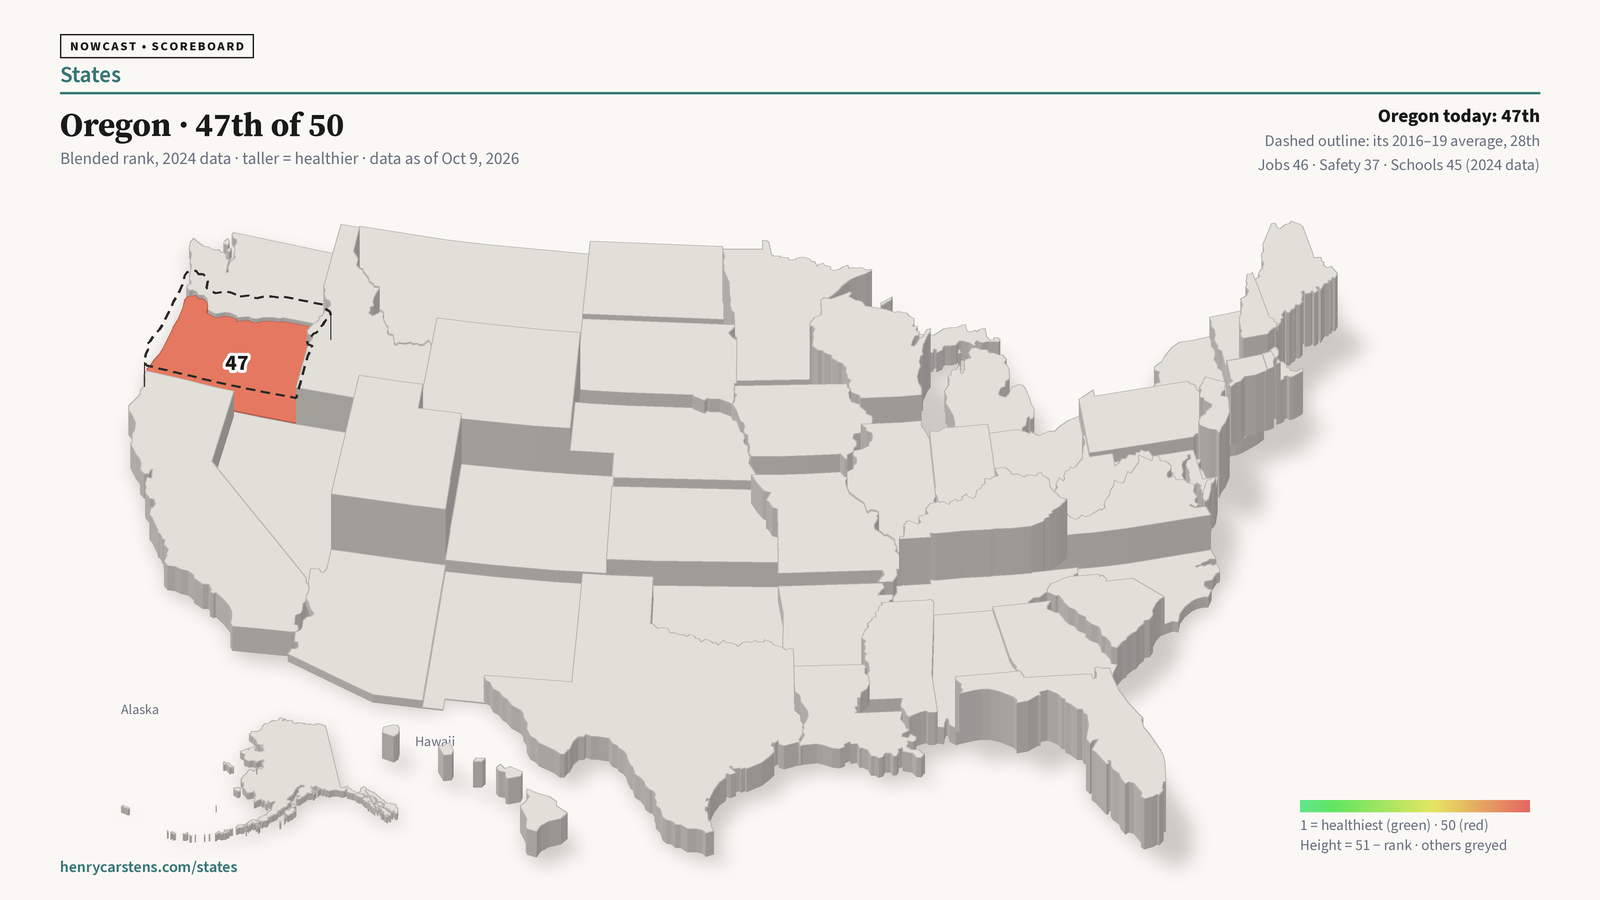
Where Oregon was
We rebuilt the blended rank for every year from 2016 to 2024, with the same sources and rules as the map. Our 2024 rebuild matches the live map.
| Year | Blended | Jobs | Safety |
|---|---|---|---|
| 2016 | 25 | 18 | 27 |
| 2017 | 24 | 12 | 29 |
| 2018 | 30 | 19 | 30 |
| 2019 | 33 | 23 | 31 |
| 2020 | 18 | 1 | 32 |
| 2021 | 46 | 49 | 36 |
| 2022 | 47 | 42 | 36 |
| 2023 | 38 | 18 | 36 |
| 2024 | 47 | 46 | 37 |
From 2016 to 2019 Oregon averaged 28th. We use that as a reference point, not as a steady normal. Oregon was already sliding then, from 25th in 2016 to 33rd in 2019, and its Schools rank had been falling since 2003. We leave out 2020, when one unusual Jobs reading put Oregon 1st on Jobs.
Three targets
- Out of the bottom 10: 40th or better.
- Back near the 2016–19 average: about 28th.
- The middle: 25th or better.
The clocks below are base rates from the past, not a forecast.
Jobs: fast, and it slips back
Oregon's Jobs rank since 2016: 18, 12, 19, 23, 1, 49, 42, 18, 46. It swings, and so does every state's. With everything else at 2024, a Jobs rank of 22nd or better gets Oregon out of the bottom 10 by itself. That already happened once. In 2023 Oregon was 18th on Jobs and 38th blended. A year later it was back to 47th.
How often does a state in the Jobs bottom 10 jump to 22nd or better? 20% of the time the next year, and 37% within two years. To 18th or better, Oregon's 2016–19 average: 19% the next year and 30% within two.
Safety: slow
Oregon's Safety number slid from 27 in 2016 to 37 in 2024. Its violent crime rank went from 15th to 27th. Its property crime rank went from 38th to 47th. Property crime is the drag.
Oregon did cut property crime 18.9% from 2022 to 2024. The typical state cut 11.4%. Oregon still stayed 47th, because most other states fell too. Holding them at 2024, Oregon needs about 16% less property crime to reach 40th on that measure, and about a third less to reach the middle. But other states keep moving. If they keep cutting at the typical three-year pace of 12.5%, Oregon needs about 27% less just to reach 40th.
Cuts that big are uncommon. About 1 in 10 three-year stretches saw a state cut property crime by a quarter or more (30 of 300, across 13 states).
Getting the Safety number back to its 2016–19 average of 29 means roughly violent 16th and property 42nd. States at 35 or worse gained 8 places within five years 12 times in 51 (24%). Within eight years it was 5 times in 14. All of those climbs came from five states: Alaska, Alabama, Delaware, Georgia, and Indiana. Four of the five touch years with thin FBI reporting, so even that rate may be generous.
Schools: slowest, and the longest slide
Oregon's Schools rank was 25th in 2003. It was 34th in 2019 and 45th in 2024. Against the 50-state average across the four tests, Oregon went from 1.5 points above in 2003 to 1.5 points below in 2019 and 5.6 points below in 2024. The slide started long before the pandemic. It steepened after 2019.
On 2024 scores, Oregon trails the 25th state by 7.7 points in grade 4 reading, 9.1 in grade 4 math, 2.5 in grade 8 reading, and 5.7 in grade 8 math.
Getting back to its 2019 standing means gaining about 4 points on the 50-state average across the four tests. Since 2003, a state has done that in two tests 14 times in 450 tries (3%). Over three tests it was 20 times in 400 (5%), in 11 states. NAEP comes every two years.
In ranks, that is about 10 places. States ranked as low as Oregon did that within two tests 4 times in 104. Within four tests, eight or nine years, it was 9 times in 82 (11%), and all of those came from five states: California, Hawaii, Louisiana, Mississippi, and Tennessee. Mississippi went from 12.6 points below the average in 2013 to even in 2024.
Putting it together
| If Oregon gets | Blended | How often low-ranked states did it |
|---|---|---|
| Today | 47 | |
| Jobs to 22nd | 40 | 20% next year. 37% within two. |
| Jobs to 18th | 36 | 19% next year. 30% within two. |
| + Safety to its 2016–19 average | 35 | 24% within five years. 5 of 14 within eight. |
| + Schools to 2019 | 30 | 11% within eight or nine years. |
Even with all three pillars back to 2016–19 levels, Oregon lands about 30th, not 28th. Other states have moved since. Letting them keep moving on their own past paths gives about 29th to 31st.
So how long?
Out of the bottom 10: one or two years is possible on Jobs alone. On the past record the odds are a bit better than 1 in 3 within two years. On Jobs alone it may not last. 2023 showed that.
Back near the 2016–19 average: it needs Schools and Safety both. On their own, those climbs happened about 1 time in 10 for Schools within eight or nine years, and about 1 in 4 to 1 in 3 for Safety. Both together is rarer than either: at most 1 in 10, and closer to 1 in 25 if the two were unrelated. If it happens, the past says it takes about a decade.
The middle: further still.
The reason is the same one that holds down the rest of the bottom 10. Jobs is a one-year flow and it bounces. Safety and Schools build over years: a grade 8 score reflects eight years of school. Oregon's Jobs number mostly shapes whether it is in the bottom 10 next year. Schools and Safety shape where it can be in ten years.
For the rest of the bottom 10, see How long until the bottom 10 get back up?
See where your state sits: https://www.henrycarstens.com/states
--h
Method. Blended rank rebuilt for 2016–2024 from the map's own sources and rules: Jobs is BLS BED NSA establishment births minus deaths over QCEW annual-average private establishments. Safety is the mean of the FBI CDE violent and property rate ranks, lowest rate first, shown on the card rounded half up. Crime rates are adjusted for FBI reporting coverage, as on the live map: reported offenses over the population the reporting agencies cover. Schools is the mean of the four NAEP grade ranks from the most recent test at or before that year. Blend = (Jobs + Safety + Schools) / 3, unrounded, ranked, ties shared. Our 2024 matches the live map for all 50 states. For 2016–2023, a state-year with FBI December coverage under 90% also has its crime rates filled in from the nearest years at 90% or better. Oregon was above 96% every year. "Points vs the 50-state average" is the mean over the four NAEP tests of Oregon's score minus the mean of the 50 state scores; the two- and three-test gain counts use that same four-test average. Scenario ranks keep the other 49 states' 2024 data and re-rank all 50 states on every pillar; holding the other states' blended scores fixed instead gives 40, 39, 35, and 30. The 29th-to-31st range lets the other states follow their own 2016–2024 trends or replay their own past changes. Safety base rates use states at 35 or worse (2016–2024); Schools uses mean grade rank 38 or worse (NAEP 2003–2024). Before NAEP's 2010 inclusion rules, states differed more in who sat the test, so early Schools ranks are less comparable. The "1 in 25" assumes the Safety and Schools climbs are unrelated, which is an assumption. These are base rates from the past, not a forecast. This page does not change the ranks or the map.