Claude usage
AI adoption isn't state health
State Claude use does not line up with the nowcast. Heavy users are not the healthier states.
Correction, Oct 9, 2026: ranks updated after adjusting crime rates for FBI reporting coverage. In this piece, the blended-rank correlation is now 0.11 (p = 0.44); it was 0.14 (p = 0.32). Safety is now 0.06; it was 0.10. Jobs and Schools are unchanged. North Dakota replaces South Dakota in the top 10. Georgia joins the Uniformly Weak group, which is now 11 states. The top-10 versus Uniformly Weak test is now p = 0.65; it was 0.85. The chart, the state examples, and the table are redrawn. The finding is the same: no meaningful link.
Anthropic publishes an Economic Index. One number in it is a per-state AI Usage Index. The short name is AUI.
AUI is a state's share of U.S. Claude use, divided by its share of the working-age population. Working age here means ages 15 to 64. A score of 1.0 means usage is in line with population. Above 1.0 means the state uses Claude more than its share of people. Below 1.0 means it uses Claude less.
We used the June 26, 2026 release. We averaged April and May 2026. The table is on Hugging Face (CC-BY). Anthropic explains the index in the June 2026 report.
We compared AUI with the States nowcast across all 50 states. Washington, D.C. is not in the nowcast, so this check leaves it out. We asked whether heavier Claude use shows up as a healthier state.
It does not. There is no meaningful link.
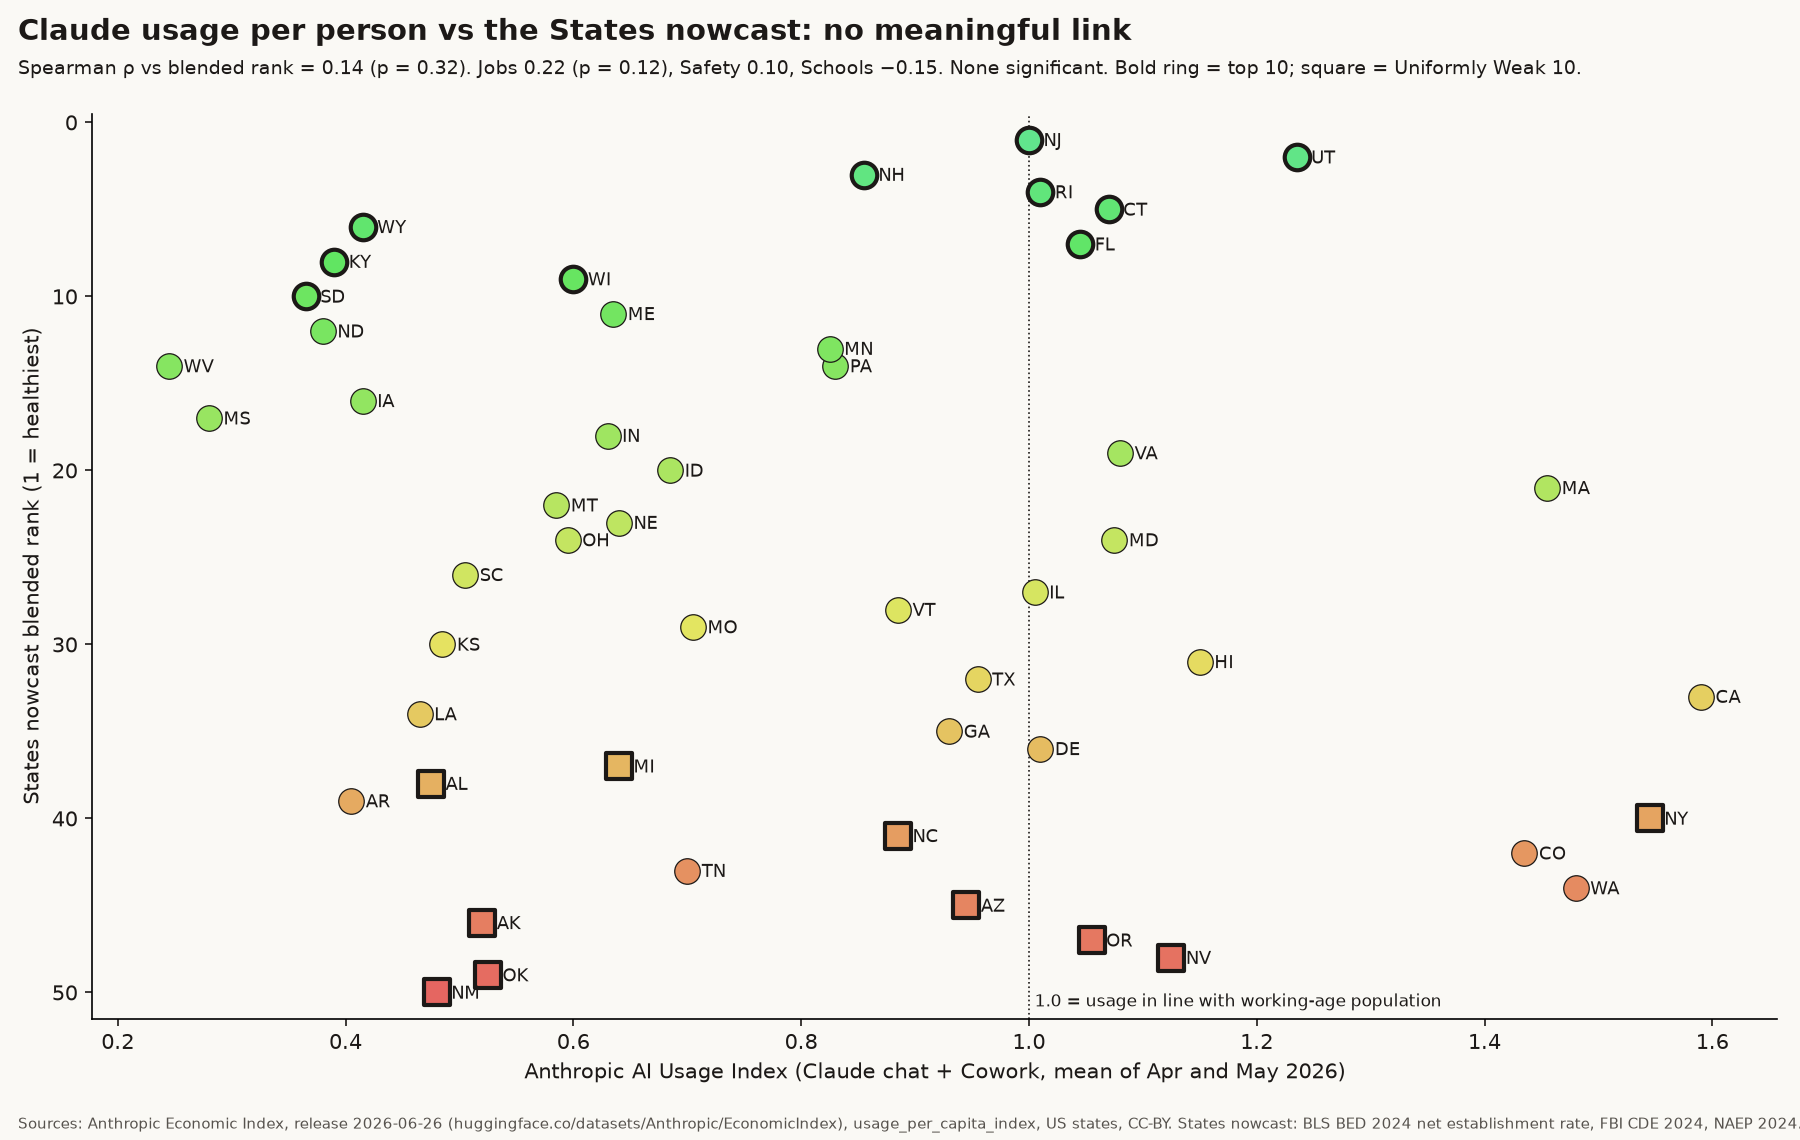
Spearman ρ against the blended rank is 0.11 (p = 0.44). Spearman ρ is a rank correlation. Zero would mean no link. 0.11 is close to zero. A p-value of 0.44 means a link this small can show up by chance. Jobs is 0.22. Safety is 0.06. Schools is −0.15. None of these is significant.
The two ends of our list look alike on usage too. The top 10 are the ten healthiest states on the blended rank. The Uniformly Weak 11 sit in the bottom half on jobs, safety, and schools at once. Those two groups sit at about the same usage levels. A Mann-Whitney test gives p = 0.65. That test asks if one group tends to sit higher than the other. Here, it does not.
A few states make the split easy to see.
New York is 2nd on usage and 40th blended. Washington is 3rd on usage and 44th blended. Colorado is 5th and 41st. Nevada is 8th and 48th. They rank among the heaviest Claude users. On the blended nowcast they sit near the bottom.
Wyoming, Kentucky, and North Dakota are in our top 10. They sit near the bottom on usage. Wyoming and Kentucky tie for 6th blended. Wyoming is 43rd on usage, and Kentucky is 46th. North Dakota is 9th blended and 47th on usage.
California is 1st on usage and 32nd blended. West Virginia is 50th on usage and 17th blended. The heaviest user is not a top state. The lightest user is not a bottom state.
| State | Usage rank | Blended rank |
|---|---|---|
| California | 1 | 32 |
| New York | 2 | 40 |
| Washington | 3 | 44 |
| Colorado | 5 | 41 |
| Nevada | 8 | 48 |
| Wyoming | 43 | 6 |
| Kentucky | 46 | 6 |
| North Dakota | 47 | 9 |
| West Virginia | 50 | 17 |
Why the lists split
Anthropic's own reports find that state usage tracks mostly the share of workers in computer and math jobs. Income matters less. That result is in the January 2026 report.
The nowcast measures other things. Jobs is BLS BED establishment births minus deaths. Safety is FBI CDE crime rates, adjusted for how much of each state's population the reporting agencies cover. Schools is NAEP test scores. A place can be full of people who use Claude and still be weak on those three. A place can be strong on those three and barely use Claude.
What this count leaves out
The state index counts Claude chat and Cowork only. It does not count Claude Code. It does not count API traffic. It is one vendor. Location is inferred from IP. Methods change between releases, so do not trend across those releases.
Close
AI use tells you where tech workers live. It isn't a scorecard for whether a place works. This stays out of the rank and off the map.
See where your state sits: https://www.henrycarstens.com/states
--h
Questions or corrections? Write me at .
Method. AUI is usage_per_capita_index from the Anthropic Economic Index, release 2026-06-26, US states, April and May 2026 averaged. DC is excluded. Spearman ρ is the rank correlation of that mean with each nowcast rank. The Mann-Whitney p compares AUI for the blended top 10 with AUI for the Uniformly Weak 11. Blended-rank colors are the same 1–50 green-to-red ramp as the map. Rank 1 is green. Rank 50 is red. Sources: Hugging Face Economic Index (CC-BY); June 2026 report; January 2026 report. Nowcast: BLS BED 2024 establishment births minus deaths, FBI CDE 2024 adjusted for reporting coverage, NAEP 2024. Ranks as of Oct 9, 2026. This page does not change the ranks, the map, or the pillar data.