Oregon
Oregon's Data Centers: Who Wins, Who Pays
Every Oregon county that hosts data centers comes out ahead, and the poorer rural counties gain the most per resident: about $7,200 a year in Morrow and $1,160 to $1,260 in Wasco, Umatilla and Crook, against $70 in Washington County. Tax given up in the deals isn't counted as a cost. The bigger cost is regional: about $792M a year in emissions if gas fills the new load.
Oct 10, 2026. What Oregon's host counties gain from data centers, what they spend, and where they land, now and in 2030. Method: abated (forgone) tax is not counted as a cost, because without the deal there is no data center and no tax to lose. The deal-pricing views that do subtract abated tax appear only as policy context (§9). Source keys are listed at the end. Download the full paper (PDF, 9 pages).
Correction, Oct 10, 2026: An earlier version of this article mixed two bases in the §6 net table. Washington County's net included the PGE tariff saving, but the low ends for Morrow and Umatilla did not include the 2025 grid line. The corrected ranges are Morrow $51.3M–$158.5M ($4,151–$12,823 per resident) and Umatilla $45.1M–$221.4M ($561–$2,750 per resident), matching §12. The mid estimates are unchanged. The net chart has been redrawn to match, including Washington at $70 per resident. We also corrected the summary's statement that public money is "about a third of each rural net": it is about a third in Morrow and Wasco, 15% in Umatilla and 4% in Crook. Minor clarifications were made to the carbon-price labels, the list of utilities the POWER Act covers, and the description of Morrow's tax dependence. None of these changes alter the conclusions.
1. Executive summary
Every host county nets positive, and the poorer rural counties gain the most per resident. Counting what each county gains (local tax and fees kept, plus resident payroll) minus the public expenses we could find, the mid estimates are [NET]:
- Morrow: about $89.6M a year, or $7,247 per resident.
- Umatilla: about $101.7M, or $1,264 per resident.
- Crook: about $32.0M, or $1,169 per resident.
- Wasco: about $30.7M, or $1,157 per resident.
- Washington (Hillsboro): about $42.6M, but only $70 per resident, because it is a large, wealthier county (this includes the PGE data center tariff saving; §8).
Four of the five host counties have median household incomes below the state median of $83,011 [ACS]. Those four gain about 16 to 104 times more per resident than Washington County. That comparison includes resident paychecks; on public money alone the range is about 2.3 to 126 times.
Public money kept by local governments, after the state school formula takes back the school share, is about a third of the net in Morrow ($32.2M, 36%) and Wasco ($11.2M, 36%), 15% in Umatilla ($15.3M) and 4% in Crook (only $1.3M). The rest is paychecks to county residents, which is household income, not budget money [NET].
These nets are upper bounds. The biggest infrastructure costs we found were paid by the companies, not taxpayers: Google about $28.5M for The Dalles's water system, Apple $8.7M for Prineville's aquifer storage, Amazon $8M for a worker RV park in Hermiston. The utilities say large customers pay their own grid costs, but no one has audited that. The only public costs with figures are the Port of Morrow's nitrate fines (up to about $1.05M a year) and about $0.11M of one-time admin in Washington County. Emergency services, roads, sewer plants and housing are not measured yet [NET].
The grid barely changes the local picture. The utilities say data centers pay for their own substations and lines (unaudited), so the local grid cost is near zero: about $0.27M a year in Morrow and $0.64M in Umatilla by 2030 (mid), and PGE's new data center tariff actually saves Washington County residents about $5.1M a year. The mid 2030 net per resident is Wasco $1,157, Morrow $7,225, Umatilla $1,256, Crook $1,169 and Washington $70 (§8, §12) [GRID].
But the local winners and the regional costs diverge. If gas fills the 2025–2030 data center load growth, the emissions cost is about $792M a year (mid; $112M–$3.1B) at EPA's 2023 social cost of carbon, $190/t (2020$, 2% discount), more than any host county's local net. That figure is assumption-driven and kept separate from the local numbers (§12).
The policy lesson is not whether to host data centers but how to price them and power them. Newer deals pay back far more per dollar abated than older ones, some breaks went to sites that would have come anyway (§9), and the POWER Act's ratepayer protection doesn't reach the co-op and PUD that serve Google and most of Amazon's load (§8). We recommend tougher deal terms instead of a ban, POWER Act-style protection for co-ops and PUDs, and clean-power conditions (§10, §12).
2. What Oregon actually did
Oregon has not halted data centers statewide. The governor's office says the state "currently lacks authority to enact a statewide moratorium" [GOV]. What it did:
- POWER Act (HB 3546), June 2025: a separate rate class for loads of 20 MW or more so they pay their own costs. It covers investor-owned utilities only (PGE, Pacific Power, Idaho Power) [ORLAW-323]. First used in PGE Schedule 96 (PUC Order 26-154, May 2026) [PUC-26-154].
- HB 4084, effective June 5, 2026: pauses new enterprise-zone tax breaks for data centers until 90 days after the 2027 session, and bars extensions. SIP deals are not affected. Seventeen applications filed just before the pause are locked in [OLIS-4084][OL-HIL].
- State land, Sept 8, 2026: no state leases, easements or sales for data centers until July 1, 2027 [GOV].
- Hillsboro: paused new SIP deals and imposed a 120-day permit moratorium to Nov 24; an acreage cap and school buffer go to a vote Oct 20 [HT][HNT].
3. Where the sites are vs county income
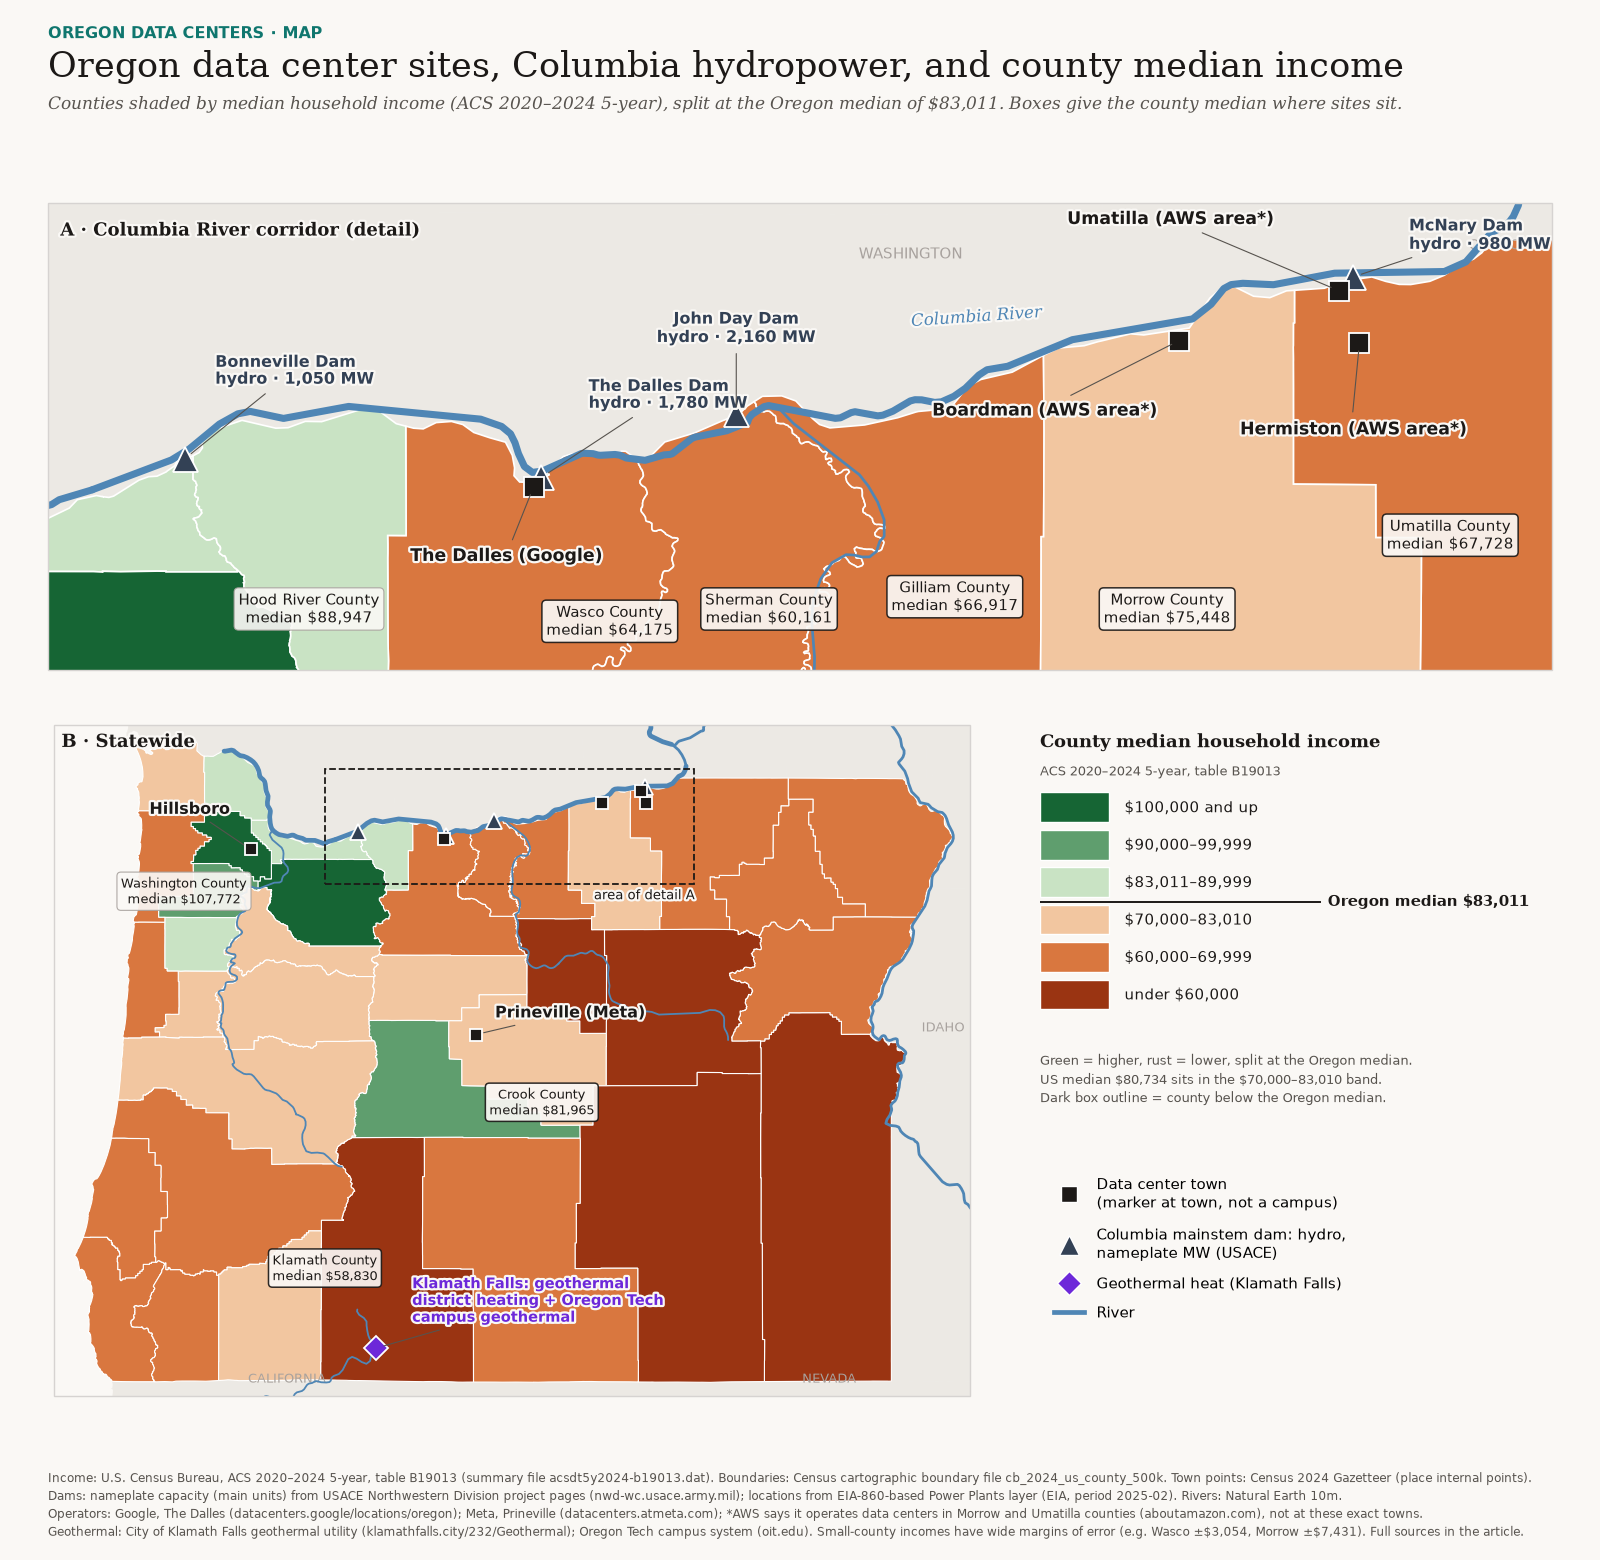
Four of the five host counties are below the state median: Wasco $64,175, Umatilla $67,728, Morrow $75,448 and Crook $81,965 (within its margin of error). Washington is at $107,772. Klamath, the geothermal hopeful, is $58,830 [ACS]. The data centers sit mostly in poorer river and high-desert counties, next to cheap Columbia hydropower. Cascade Locks is not a host; its only proposal was cancelled in 2023 [PCL-2023].
4. Gains per county
Two kinds of gain, kept apart because they land in different pockets [NET][LEDGER]:
| County | Local tax & fees kept, $M/yr (low / mid / high) | Memo: school share sent to state formula | Resident payroll, $M/yr |
|---|---|---|---|
| Wasco (Google) | 10.1 / 11.2 / 11.7 | 1.5 / 1.9 / 2.2 | 9.1 / 19.5 / 33.3 |
| Morrow (Amazon) | 30.8 / 32.2 / 34.3 | 6.9 / 6.9 / 10.3 | 22.1 / 57.4 / 124.2 |
| Umatilla (Amazon) | 14.7 / 15.3 / 16.1 | 2.8 / 3.7 / 4.2 | 31.7 / 86.4 / 205.3 |
| Crook (Meta, Apple) | 1.2 / 1.3 / 1.4 | 0.06 / 0.08 / 0.10 | 17.6 / 30.7 / 61.3 |
| Washington (Hillsboro) | 11.3 / 12.6 / 14.4 | 6.2 / 8.0 / 9.3 | 13.3 / 25.0 / 35.2 |
- Local tax and fees kept is property tax and deal fees that stay with the county, cities, port, fire and other districts. School bonds and local option levies stay local too [LEDGER].
- The school share of the property tax is shown separately and not counted. Oregon's formula cuts a district's state aid by about one dollar for each local dollar, so that money effectively goes to the statewide pot [ORS-327.013][ORS-327.011].
- Resident payroll is wages of data center workers who live in the county (LEHD 2022 resident shares times a wage range) [DEALS]. It is private income. Umatilla's is largest because about 79–80% of its jobs go to residents [DEALS].
- Construction payroll is not included; it's only available for Eastern Oregon as a whole [NET].
- Crook keeps little public money because Meta and Apple are almost fully abated; Meta's first building comes off its exemption after FY2026-27, adding about $16.5M a year to the tax roll [LEDGER].
- Morrow is concentrated: Data center property tax is about 32% of the county levy; counting deal fees, data center revenue equals about 45% of it, a dependence risk like Loudoun County, VA's [ECO][DEALS][LOUDOUN].
Jobs are modest: about 0.84 permanent direct jobs per MW statewide [ECO], and median household income did not move measurably in any host county [JOBS].
5. Expenses per county
Big costs paid by the companies (not counted as public costs) [NET][OPB-0115]: - Google, The Dalles: about $28.5M in water infrastructure (aquifer storage and pipes, handed to the city in Oct 2025). - Apple, Prineville: $8.7M for the city's aquifer storage and recovery (ASR) system; Meta is paying $1–3.2M for a second well. - Amazon, Hermiston: $8M for a contractor RV park. - Grid: Northern Wasco PUD, Umatilla Electric and PGE Schedule 96 put large-load infrastructure costs on the customer. That is the utilities' own account; it has not been independently audited. - Roads, Morrow: the 2022 road-use agreement with Amazon had zero net budget impact; the Aug 2026 Tower Road terms are unknown. - Hillsboro: data centers use 1.76% of city water and pay industrial rates plus system development charges.
Public costs we found [NET][WATER]: - Port of Morrow nitrate fines: DEQ fines of $2.4M, $727K and $11.7K (2023–25), about $1.05M a year on average. We assign $0 (low), 4%, Amazon's share of Port water (mid, $0.04M), or all of it (high). - Washington County admin: about $0.11M, one-time, for enterprise-zone applications.
Gaps (not yet subtracted): 1. Emergency services everywhere (for scale, Morrow's 911 fund spent $1.0M in FY26). 2. Roads outside Morrow. 3. The data center share of The Dalles's Wicks water plant replacement (partly funded with Google SIP money). 4. Port of Morrow lagoon capital costs. 5. Hermiston and Umatilla wastewater. 6. Pacific Power's past cost split for Crook. 7. Housing: shortages are documented (Boardman 250+ homes, Hermiston 1,200 units) but there is no public dollar figure. 8. Admin in counties other than Washington.
6. Net per county and per resident
| County | Net $M/yr, mid (range) | Net $ per resident/yr, mid (range) | Public budget part, mid |
|---|---|---|---|
| Wasco | 30.7 (19.2–45.0) | 1,157 (725–1,698) | 11.2 |
| Morrow | 89.6 (51.3–158.5) | 7,247 (4,151–12,823) | 32.2 |
| Umatilla | 101.7 (45.1–221.4) | 1,264 (561–2,750) | 15.3 |
| Crook | 32.0 (18.8–62.7) | 1,169 (689–2,294) | 1.3 |
| Washington | 42.6 (24.5–54.6) | 70 (40–89) | 12.6 |
Net = gain minus quantified public expenses and the 2025 local grid cost (§8). Washington includes the PGE Schedule 96 tariff saving of about $5.1M a year (§8). Population: Census 2024 estimates. Source: [NET][GRID].
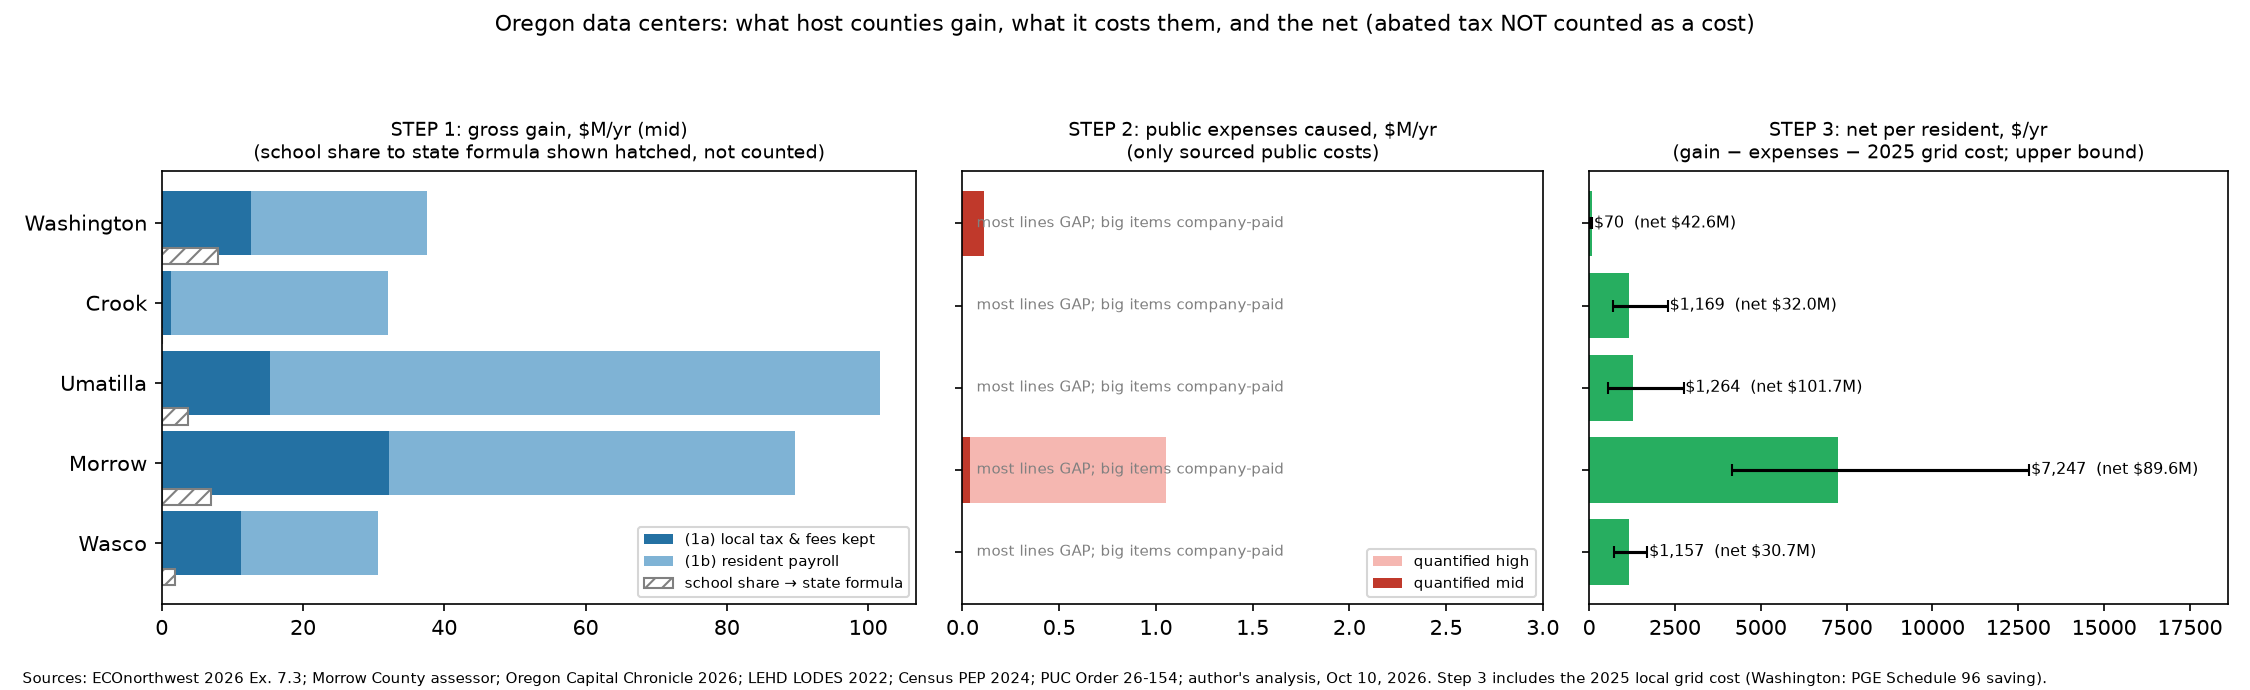
What it shows. Every host county comes out ahead even at the low end of each range. Morrow gains most per person by far. Umatilla gains most in total, mostly through resident paychecks. Crook's gain is nearly all payroll, not public money. Washington's gain is real but small for a county of 600,000. Because public expenses are mostly unmeasured, read every figure as a ceiling.
7. Water: how it's used and where it goes
What the water does. Most of it is for cooling. In an evaporative cooling tower, warm water is sprayed through moving air; a small share evaporates and carries the heat away, the way sweat cools skin. The tower loses about 1% of its flow for every 10°F of cooling [HPAC][EPA-CT]. Smaller amounts humidify server halls. Evaporation leaves minerals behind, so towers regularly drain concentrated water ("blowdown") and add fresh water [SPX].
How much evaporates. At typical settings about 75–80% evaporates and 20–25% is discharged [EPA-CT][SPX]. In 2024 Google's The Dalles campus withdrew about 461M gallons, evaporated about 78% and sent about 22% to the city sewer [CotR][WATER]. Google consumed about 550M gallons in 2025, nearly 40% of city water [OL-WATER]. Amazon's Oregon campuses withdrew about 284M gallons in 2024 and publish no split [AWS-ODOE].
Where the vapor goes: not gone for good. Evaporated water leaves the local river, aquifer and water rights, but it rejoins the atmosphere and falls as rain or snow downwind, often east of the Cascades or out of state (our judgment; not modeled) [USGS-WC]. It is lost to the town's watershed, not to the planet.
Where the blowdown goes. - The Dalles: to the city sewer and treatment plant, likely discharged to the Columbia (unconfirmed) [WATER]. - Hermiston: into irrigation district canals [WATER]. - Umatilla: piped to an irrigation canal, irrigating about 10,400 acres [CAPPRESS-2021]. - Port of Morrow: into the Port's wastewater system and spread on farms in a basin already high in nitrate. Evaporation concentrates nitrate in blowdown. Besides the DEQ fines above, Amazon agreed to a $20.5M settlement with residents in March 2026 without admitting fault [OCC-0331][WATER].
Trade-off: air and closed-loop cooling use little water but more electricity [LBNL-2024]. Residential water bills in The Dalles are projected to nearly double by 2036, from about $57 to $115 [OPB-0115].
8. The grid: local cost now and in 2030
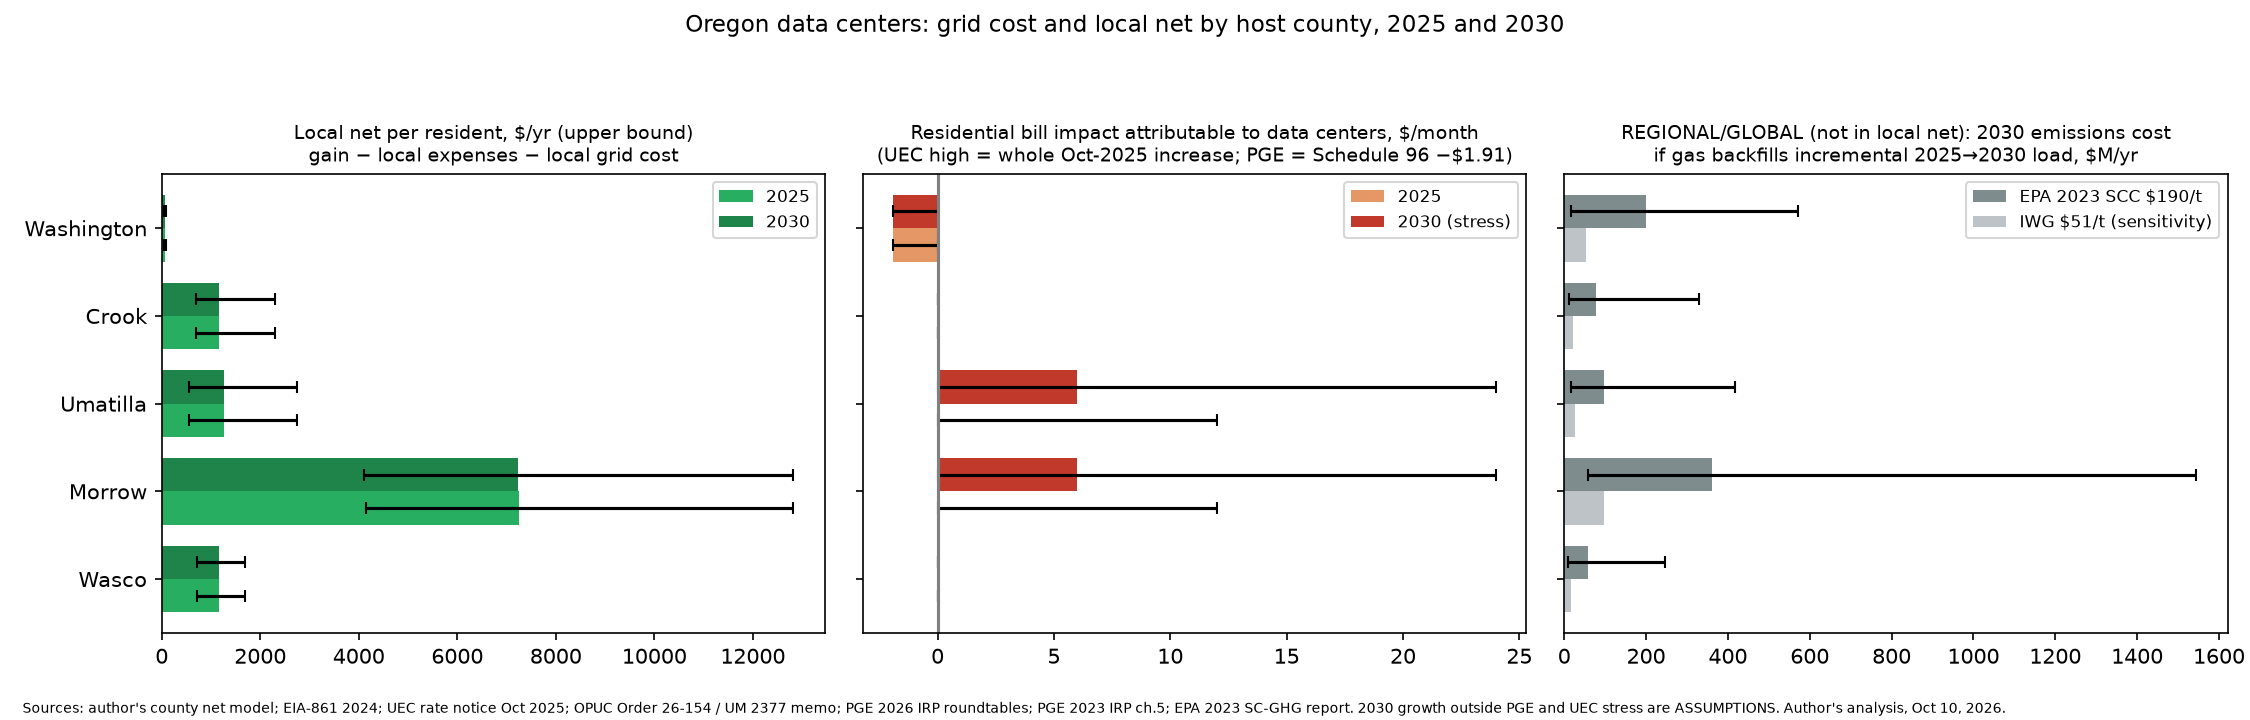
Local grid cost is near zero, on the utilities' own unaudited claims. Northern Wasco PUD, Umatilla Electric, Pacific Power and PGE all say large data center customers pay up front or by direct assignment for the substations, lines and upgrades they need. No independent cost audit exists, and how much sits in local rate bases is a gap [GRID].
| Utility (county) | Residential bill impact, $/month: low / mid / high, 2025 | 2030 | Note |
|---|---|---|---|
| Umatilla Electric (Morrow, Umatilla) | 0 / 0 / 12 | 0 / 6 / 24 | High 2025 case blames all of October's increase on data centers; 2030 is a stress ASSUMPTION |
| PGE (Washington) | −1.91 (saving) | −1.91 to 0 | Schedule 96 data center tariff |
| Northern Wasco PUD (Wasco) | 0 | 0 | Formula rate; GAP |
| Columbia Basin Electric | 0 | 0 | Oct 2025 increase came from BPA, not local load |
| Pacific Power (Crook) | GAP | GAP | Spread across ~547k Oregon residential customers: a state cost, not a Crook one |
In dollars, the local grid cost (residential cost shift) in 2030 is about $0.27M a year in Morrow (0–1.09) and $0.64M in Umatilla (0–2.54), and zero in Wasco and Crook. PGE's tariff saves Washington County about $5.1M a year (−$1.91/month; county share assumes 28% of PGE households), entered as a negative cost [GRID].
The POWER Act gap. HB 3546 covers only OPUC-regulated utilities (PGE, Pacific Power, Idaho Power). It does not cover Northern Wasco PUD (Google) or Umatilla Electric (Amazon, about 2,000 MW), which serve most Oregon data center megawatts. There, protection rests on board policy alone: no OPUC review, required minimum contract, exit fee or community charge. HB 2021's clean-energy targets also bind only the investor-owned utilities, so gas or market backfill is least constrained exactly where load grows fastest [GRID].
BPA Tier 2 from October 2028. Under BPA's new Provider of Choice contracts, load above each utility's cap (Contract High Water Mark) is served at the higher Tier 2 rate or from dedicated resources, not cheap Tier 1 hydro. That keeps data center growth off other utilities' Tier 1 cost pools by design; local exposure depends on how each PUD or co-op board spreads its Tier 2 and market costs. The post-2028 long-term Tier 2 rate is a gap [GRID].
9. Policy levers (supporting context)
These come from earlier analyses that framed abated tax as a deal's price. They don't change §6, but they show where better terms would pay off.
- Newer deals price better. Deals signed since 2021 pay about $0.54–$0.59 per $1 abated (Google 2021, Amazon Morrow 2023), against $0.01–$0.26 for 2012–2020 deals [DEALS].
- Which breaks were decisive. Comparing power, tax and build costs with Quincy WA, Idaho, Utah and Nevada: the break plausibly swung The Dalles, Prineville and Hermiston (covers 84% of the gap with Quincy). It likely was not needed at Boardman, where co-op power was already cheaper (about an 83% chance Amazon comes anyway), or Hillsboro, which wins on fiber (71%) [SITES]. MW per campus varies up to 7× across trackers, and prices are 2024's, so treat this as indicative.
- Letting counties keep the school share. If host districts kept 100% of it: Morrow +$6.9M a year (about +$2,124 per pupil), Umatilla +$3.65M, Wasco +$1.9M, Crook +$0.08M. Every other district would pay about $19 per pupil, and poor districts like Fossil and Mitchell can't replace it [KEEP]. Abatement terms are the bigger lever: a 25% smaller break at Morrow gives locals about $19M a year and adds to the state school fund instead of draining it [KEEP]. Even where that money reaches classrooms, schools are the slow pillar: Morrow's gain of a quarter to half a standard deviation would build over about a decade and move no state rank [KEEP].
- POWER Act gap. Its cost protection reaches IOU customers only, not Google (Northern Wasco PUD) or Amazon's Umatilla Electric sites [ORLAW-323][APPA][COBANK].
- Klamath geothermal is small. Oregon has two geothermal plants (about 22 MW and 2 MW) [DOE-NHS][ET-OIT]; Klamath could support a campus of 20 MW or less, worth about $0.2–1.2M a year to its schools under a keep-the-school-share rule [KEEP].
10. Recommendations, tied to Jobs, Safety and Schools
The Oregon 5-year plan ranks the state 47th of 50 (Jobs 46th, Schools 45th) and bets on housing for Jobs and on reading, K–5 math coaches and a protected school reserve for Schools [OR-5YR].
- Keep hosting; replace the pause with conditions, not a ban. Host counties net positive. When HB 4084 expires, require minimum payments, exit fees, curtailment rights and published water use. (Jobs.)
- Size breaks to the cost gap. Offer abatements only where Oregon's site costs exceed competitors', capped at that gap, with clawbacks; revisit windfall deals like Boardman's at renewal. (Jobs, Schools: more tax base per site.)
- Route school money around the formula. Use bond support and earmarked grants for the plan's reading package and math coaches, which stay local; ask ODE to rule on whether SIP community service fees are offset. Schools is the slowest pillar to move, so judge this over a decade, and start early, as How to Fix K-12 argues. (Schools.)
- Fund emergency services from deal fees. Emergency services are the largest unmeasured public cost; write a per-MW public-safety payment into new deals. (Safety.)
- Spend fee money on housing in Boardman and Hermiston, where shortages are documented. (Jobs.)
- Build stabilization reserves in Morrow and Wasco, Loudoun-style, given Morrow's 32–45% dependence. (Schools, Jobs.)
- Extend cost protection to PUDs and co-ops by legislation or BPA action, and give Klamath a small-load geothermal lane after water and transmission checks. (Jobs.)
11. Open gaps and sources
Gaps: grid: utility capex in rate base, independent cost audits (NWCPUD, UEC), Pacific Power legacy Meta/Apple allocation, post-2028 BPA Tier 2 rate, 2030 MW and gas share, 2030 gains (held flat). Earlier: (1) every public expense line in §5; (2) Hillsboro's data-center-only abatement and fees; (3) Umatilla FY2025-26 fees paid; (4) county school shares of the tax rate (30–45% assumed); (5) whether SIP fee school shares are offset; (6) construction payroll by county; (7) Amazon's job split between Morrow and Umatilla; (8) MW per campus; (9) Amazon's water split and The Dalles outfall; (10) four ledger sources and Google's site tables to page-check; legal citations in the school-share analysis still need page-checking.
Sources - Author's analysis, Oct 10, 2026, built from the public sources below: NET (county gains, expenses and net), GRID (grid cost and 2030 cost-benefit), LEDGER (county-by-site tax and fee ledger), DEALS (deal scores), SITES (site-cost comparison), KEEP (school-share scenarios), WATER (water use and discharge), JOBS (host-county income and jobs comparison). Map: author's analysis. - ACS: U.S. Census ACS 2020–24, B19013. Population: Census PEP 2024. LEHD LODES 2022. - GOV: Oregon Governor, Sept 8, 2026. ORLAW-323: 2025 Or. Laws ch. 323 (HB 3546). PUC-26-154: Oregon PUC Order 26-154. OLIS-4084: HB 4084 enrolled. HT, HNT: Hillsboro Today; Hillsboro News-Times, Oct 8, 2026. OL-HIL: OregonLive, Oct 2026. - ORS-327.011, ORS-327.013: oregon.public.law. - ECO: ECOnorthwest, Understanding Oregon's Data Center Industry (2026). LOUDOUN: Loudoun Now; Loudoun County FY2026 review. - OPB-0115: OPB, Jan 15, 2026. OL-WATER: OregonLive, Apr 2026. CotR: Clouds on the Range (secondary). AWS-ODOE: AWS to ODOE, Mar 27, 2026. CAPPRESS-2021: Capital Press, Sept 20, 2021. OCC-0331: Oregon Capital Chronicle, Mar 31, 2026. - HPAC; EPA-CT: EPA WaterSense at Work §6.3; SPX Cooling; USGS-WC: USGS "The Water Cycle"; LBNL-2024: Shehabi et al., LBNL-2001637. - APPA: publicpower.org, July 22, 2025. COBANK: CoBank UEC case study. DOE-NHS: energy.gov; ET-OIT: Energy Trust. PCL-2023: Port of Cascade Locks, July 20, 2023. - OR-5YR: henrycarstens.com/states/articles/oregon-5yr.
12. Conclusion: cost-benefit
Each county's local cost-benefit: gain (local tax and fees kept plus resident payroll), minus quantified local public expenses, minus local grid cost. Abated tax is not counted. Gains are held at 2025 levels for 2030. Mid (low–high).
| County | Gain $M/yr | Local expenses $M/yr | Local grid cost $M/yr, 2030 | Net $M/yr, now | Net $M/yr, 2030 | Net $/resident, now | Net $/resident, 2030 |
|---|---|---|---|---|---|---|---|
| Wasco | 30.7 (19.2–45.0) | 0 | 0 | 30.7 (19.2–45.0) | 30.7 (19.2–45.0) | 1,157 (725–1,698) | 1,157 (725–1,698) |
| Morrow | 89.6 (52.9–158.5) | 0.04 (0–1.05) | 0.27 (0–1.09) | 89.6 (51.3–158.5) | 89.3 (50.8–158.5) | 7,247 (4,151–12,823) | 7,225 (4,107–12,823) |
| Umatilla | 101.7 (46.4–221.4) | 0 | 0.64 (0–2.54) | 101.7 (45.1–221.4) | 101.1 (43.9–221.4) | 1,264 (561–2,750) | 1,256 (545–2,750) |
| Crook | 32.0 (18.8–62.7) | 0 | 0 (legacy GAP) | 32.0 (18.8–62.7) | 32.0 (18.8–62.7) | 1,169 (689–2,294) | 1,169 (689–2,294) |
| Washington | 37.6 (24.6–49.6) | 0.11 | −5.1 (saving; −5.1–0) | 42.6 (24.5–54.6) | 42.6 (24.5–54.6) | 70 (40–89) | 70 (40–89) |
"Now" includes the 2025 grid line (Umatilla Electric high case up to $0.55M Morrow, $1.27M Umatilla). All nets are upper bounds: emergency services, roads, sewer plants, housing and utility rate-base capex are unmeasured. Source: [GRID][NET].
Locally, every host county wins, now and in 2030. The grid barely moves the nets, on the utilities' unaudited claims, and in Washington County PGE's tariff turns the grid into a small gain.
Regional line (separate; assumption-driven, not part of any county's net). If gas fills the 2025–2030 data center load growth, the added emissions cost is about $792M a year (mid; $112M–$3.1B) at EPA's 2023 social cost of carbon, $190/t (2020$, 2% discount), or about $213M at the 2021 interim federal value, $51/t (2020$, 3% discount). Even the mid figure exceeds every host county's local net. This rests on assumed county growth rates and gas shares (only PGE's load growth is sourced) and is a global damage, not a local bill. So the local winners and the regional costs diverge: the counties keep the gains, while the climate and Northwest ratepayers carry the costs.
What this means for policy. Oregon should keep hosting data centers but price the deals better, sizing breaks to real cost gaps and putting fees and minimum payments in every renewal. It should extend POWER Act-style ratepayer protection to the co-ops and PUDs that serve most data center load, starting with Umatilla Electric and Northern Wasco PUD. And new deals should carry clean-power conditions so that growth doesn't backfill with gas, which is what would turn local wins into a regional loss.
--h