Oregon
A Five-Year Plan for Oregon
Oregon is 47th of 50. Five years won't bring it back to the middle. They can start the slow work now, take the quick win without counting on it, and tell us by 2031 whether the plan is working.
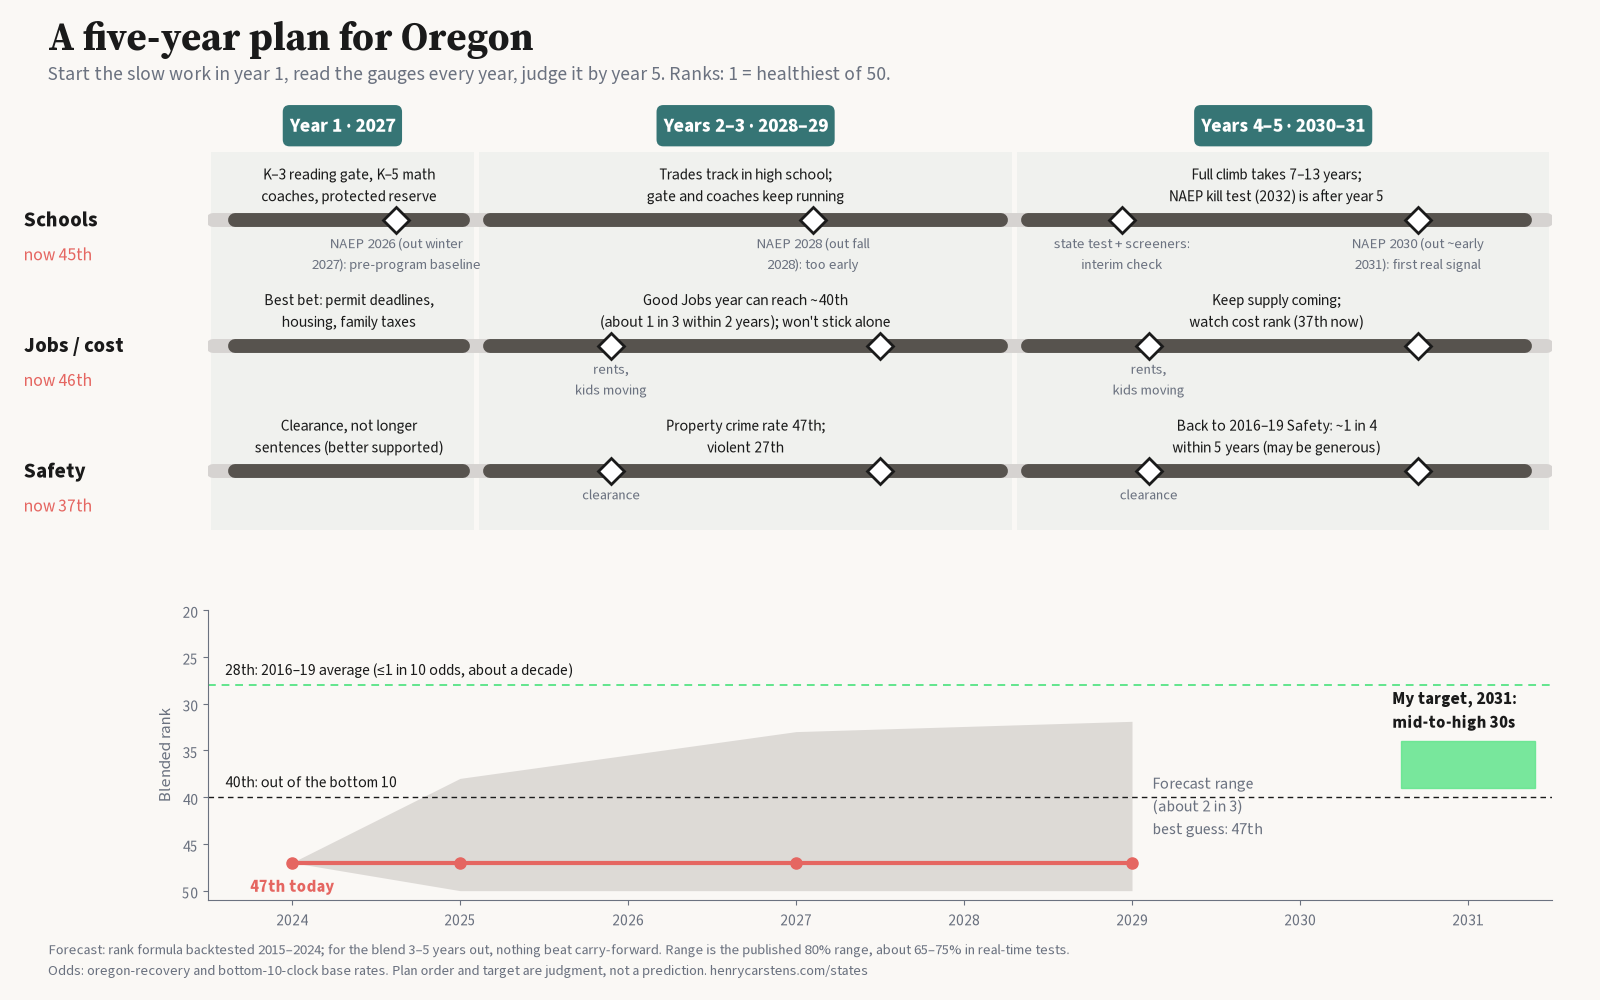
Oregon ranks 47th of 50 on our blended rank: Jobs 46th, Safety 37th, Schools 45th. From 2016 to 2019 it averaged 28th (How long will it take Oregon to recover?).
An honest note first: our forecast says the best guess for Oregon's rank three to five years out is today's rank, 47th. For Schools, Safety and the blended rank, nothing we tested beat "it stays where it is" at that range. The likely range for 2029 is wide, roughly 32nd to 50th. So this is a plan, not a prediction: where to aim, what to watch, and when we'll know. The ordering and targets are my judgment; the numbers are evidence.
Year 1: start everything at once
Schools. Copy Mississippi's package, not just its gate: a K–3 reading gate with tutoring and a summer retest, reading coaches, and teacher training. Add math coaches in grades K–5 (K–5 rather than K–8 is my call; the evidence doesn't pick). Mississippi went from 50th on Schools in 2013 to 26th (How to Fix K-12). The gate alone didn't do that. Studies near the cutoff find reading gains but no change in math, which is why the plan adds math coaches.
Schools goes first because it is the slowest. The biggest Schools climbs since 2003 took 7 to 13 years (How long until the bottom 10 get back up?). Oregon's slide began in 2003. Adjusting for student mix moves it from 45th to 48th, not up. The case is Oregon's own kids. We found no sign that school ranks pull movers in (movers-cost).
A protected school reserve. Put the program's money in a fund the legislature can't raid in a bad year. After the Great Recession, students in states that cut K–12 spending had lower test scores and college-going, and gaps by income and race widened (Jackson, Wigger & Xiong, 2021, AEJ: Economic Policy).
Jobs is a cost and housing problem. Oregon is 37th on our cost rank and 41st on housing burden. Since 2020, moves between states have tracked cost, and Jobs has tended to follow moves, partly because newcomers start businesses (movers-cost). So our best bet for Jobs is permits with deadlines, more housing, and lower taxes on families, not business incentives. That more supply will lower Oregon's costs is untested in our data. In 2022–24 the group Oregon most clearly lost was children (Who Is Oregon Losing?).
Safety: catch property criminals, rather than sentence them longer. Oregon is 47th on its property crime rate, against 27th on violent crime. The better-supported lever is more investigators and more cases solved. Oregon cut property crime 18.9% from 2022 to 2024 and still stayed 47th, because other states cut too.
Years 2–3: a realistic first exit, and three gauges
One good Jobs year could lift Oregon to about 40th, out of the bottom 10. States in the Jobs bottom 10 got to 22nd or better 37% of the time within two years, a bit better than 1 in 3. It won't stick on its own. In 2023 Oregon hit 18th on Jobs and 38th blended, then fell back to 47th a year later.
Watch three things each year:
- Rents. Our test of the "housing brake" is weak: rents rising faster came with slightly less in-migration, but only in four years of data. Rents are a gauge, not proof.
- Kids moving. Is the net loss of children (−1.8 ± 0.5 per 1,000 a year in 2022–24, a survey estimate) shrinking?
- Clearance. Are more property crimes solved? Compare with Oregon's own past; we don't rank clearance.
High schools should add a Trades track in these years: a diploma, an industry credential and paid work hours, with core math and reading kept (k12-fix).
Years 4–5: the first real Schools signal
NAEP 2026 was given before the plan starts; its results, due winter 2027, are the baseline. NAEP 2028 results (fall 2028) come too early: its 4th graders would have had about half a year of the gate. The first real grade 4 read is NAEP 2030, with results around late 2030 or early 2031. The honest test, no gain by the second post-launch NAEP (2032), lands after this five-year window. Inside it, the checkpoint is Oregon's own K–3 screeners and 3rd-grade state test. Those are interim signals, not NAEP.
Five years can only start a 7-to-13-year Schools climb. My target for 2031 is the mid-to-high 30s on the blended rank, out of the bottom 10 with Schools heading up. Getting back near 28th needs Schools and Safety both climbing. That happened at most 1 time in 10, and took about a decade (oregon-recovery). The path, one pillar at a time: 47th today, 40th with a good Jobs year, 36th with a great one, 35th with Safety back to its 2016–19 level, and about 30th with Schools back to 2019.
Jobs bounces year to year; Schools and Safety build (The Rise and Fall of the 50 States). Jobs decides whether Oregon is in the bottom 10 next year. Schools decide where it is in ten.
--h
Method.
- Ranks: live States map, 2024 data. 1 = healthiest. Blended = mean of Jobs, Safety and Schools ranks, re-ranked.
- Forecast: rank formula backtested on 2015–2024. Only Jobs, and the blend one year out, beat carry-forward. The 2029 blended range (about 32nd to 50th) is an 80% range that behaved more like 65–75% in real-time tests.
- Base rates: from oregon-recovery and bottom-10-clock (2016–2024 ranks; NAEP 2003–2024). Scenario steps hold the other 49 states at 2024.
- Housing brake: two-way fixed effects, 2015–2023. Rent signal −0.25 per 1,000 per point of rent growth, p 0.047, four usable years.
- Student mix: 2024 NAEP, grades 4 and 8 reading and math, adjusted for race/ethnicity and economic disadvantage (the 2024 "economically disadvantaged" flag, not school-lunch eligibility, so not comparable with 2019): Oregon 45th raw, 48th adjusted.
- NAEP calendar: NCES/NAGB schedules. 2026 results est. winter 2027; 2028 est. fall 2028; 2030 state reading and math in grades 4 and 8.
- Safety ranks: coverage-adjusted FBI crime rate ranks. No clearance rank is computed.
- Evidence vs opinion: the plan's ordering, the reserve design, the 2031 target and the "right bet" on housing are my judgment. These are correlations, not causes.