Oregon
Oregon Leads the Nation in Protests With Injuries or Property Damage
Oregon has more protests with reported injury or property damage per resident than any other state: 0.90 a year per 100,000 residents in 2020–25, 3.4 times New York. It was highest in four of six years and still leads with 2020 left out. Most of it is Portland, and it doesn't track our Safety ranking. The counts come from news and social-media reports, which may cover Portland more completely than other places.
Correction and update, Oct 11, 2026: An earlier version of this article said that without Portland, Oregon would rank about 46th–47th. Recomputed with Portland's events and population removed, Oregon is 49th of 50 (50th = most unrest), just behind New York; it is no longer an outlier, but it is still second-highest. We also changed "violent or destructive" to "with reported injuries or property damage" in the headline, first sentence and chart, because one broken window or one minor injury counts as a full event. We added a reporting caveat to the summary, Oregon's year-by-year trend, and named sources for how the protest data is collected, in place of an unsourced reference to social media reports (see Sources below). No other findings changed.
Oregon has more protests with reported injuries or property damage per resident than any other state. That was true in 2020, and it is still true with 2020 left out. Oregon was the highest state in four of the six years from 2020 to 2025; it was second to Rhode Island in 2023 and to New York in 2024.
We counted in-person protests where any injury or property damage was reported, using the Crowd Counting Consortium's public event data (Harvard Dataverse), and divided by state population. From 2020 to 2025, Oregon averaged 0.90 such events per 100,000 residents per year. That is 3.4 times New York, the next-highest state at 0.26. Washington (0.24), New Mexico (0.20), Minnesota (0.20) and California (0.18) follow. Alaska and West Virginia had none reported; Mississippi and Texas were next lowest.
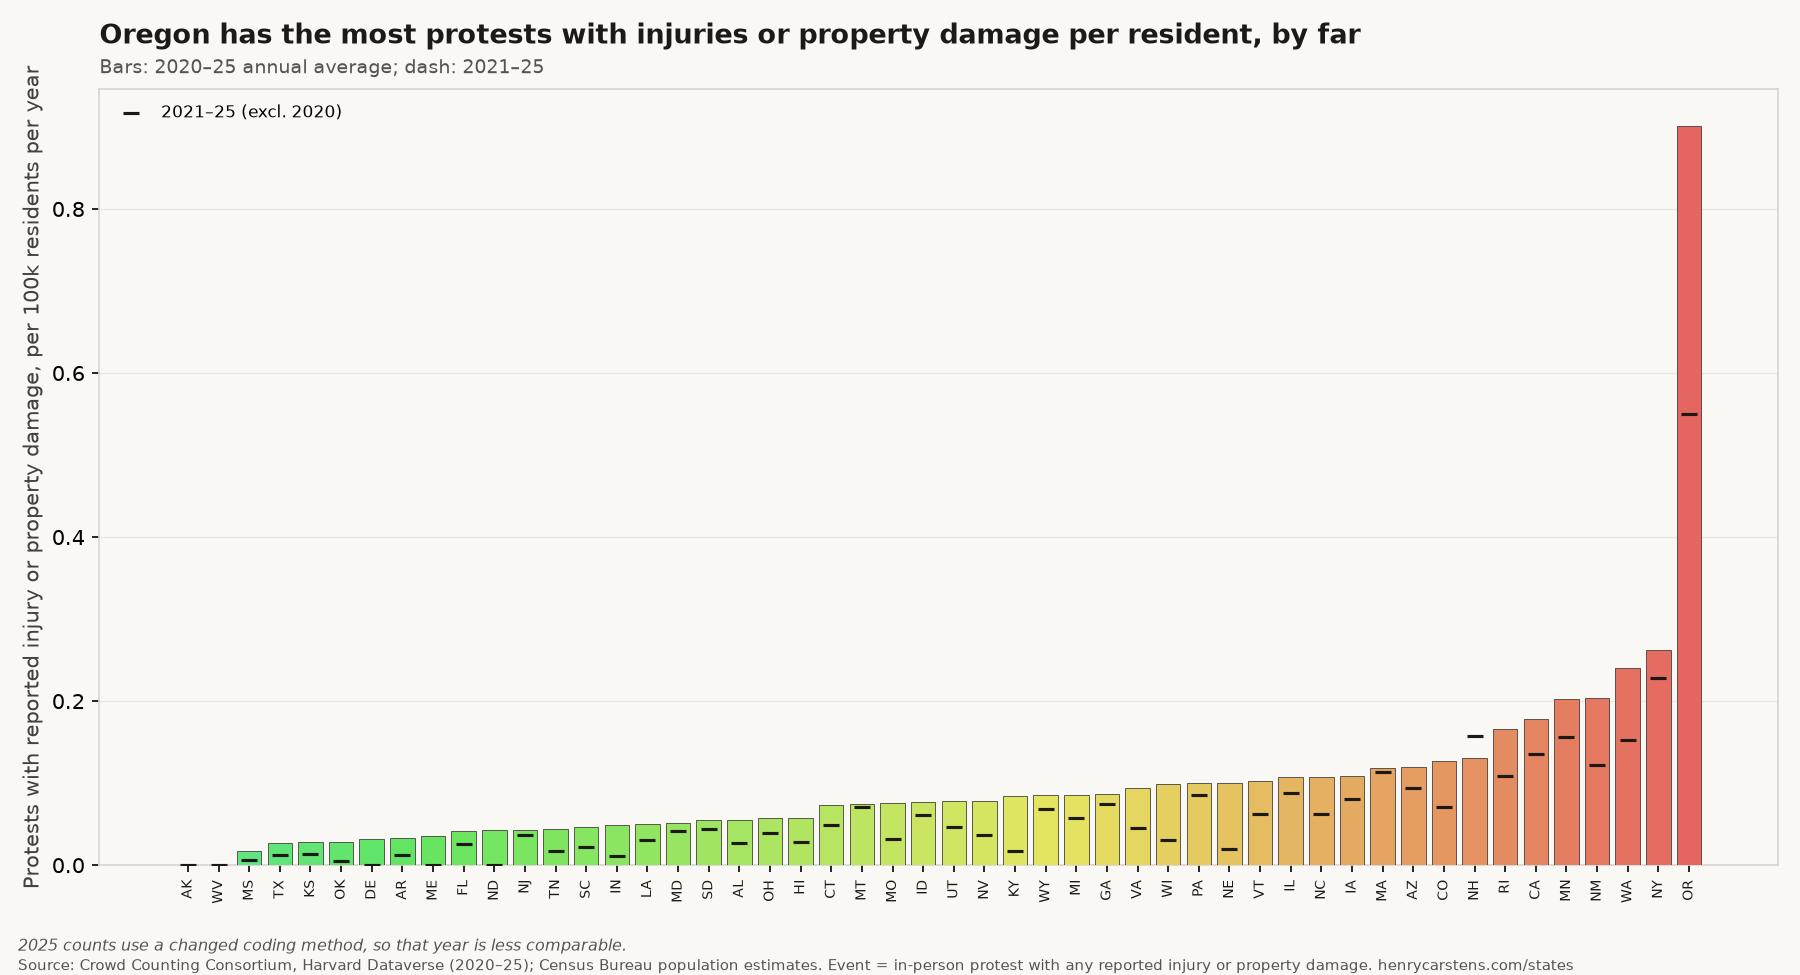
It isn't just 2020. 2020 accounts for 42% of the injury-or-damage events in the data. Drop that year and Oregon still leads, at 0.55 per 100,000 a year for 2021–25. It has fallen sharply, from 2.66 per 100,000 in 2020 to 0.31 in 2023, with a rise to 0.54 in 2024; 2025 (0.21) isn't comparable because of a coding change.
It's mostly Portland. Portland accounts for 76% of Oregon's injury-or-damage events (74% for 2021–25). Without Portland, Oregon would still be the second-highest state, 49th of 50 (where 50th is the most unrest), just behind New York, so it is no longer an outlier.
It doesn't track our Safety ranking. Across the 50 states, this unrest rate has essentially no relationship with our Safety pillar (Spearman ρ = −0.06) or our overall ranking. The only thing it lines up with is how urban a state is (ρ = 0.34 for 2020–25; 0.40 for 2021–25). FBI disorderly-conduct arrests don't track it either; those numbers mostly reflect how each state charges the offense. Oregon's high mental illness rate turned out the same way: real, but unrelated to where states land in our ranking. Neither one explains why Oregon ranks low. For that, see How long will it take Oregon to recover? and How long until the bottom 10 get back up?
Caveats. The Crowd Counting Consortium, run by Harvard Kennedy School's Ash Center and the University of Connecticut, builds its data from publicly reported events, recording what it finds in the sources it tracks, mostly commercial news outlets and social media [1, 2]. ACLED, the other major U.S. protest dataset, also codes events from public reporting [3, 4]. Portland's 2020 protests were covered by national outlets as well as local ones [5, 6, 7]. Because the counts depend on reporting, places with heavy coverage get counted more completely, and a zero means nothing was reported. Portland's nightly protests count as many separate events. A broken window counts the same as a riot; there is no severity weighting. A 2025 change in how the data is coded makes that year less comparable. And with small counts, ranks below the top half-dozen states are mostly noise. Oregon's lead is large, but media-based counting and Portland's repeated nightly protests could inflate it. Even without Portland, Oregon would rank 49th of 50 (50th = most unrest).
We're not adding this to the ranking. It's a separate problem, concentrated in one city, and it belongs alongside the rest of the Oregon picture: who is leaving Oregon, the health plan tax that would push Portland's top rate over 60%, Oregon's data centers, and a five-year plan for Oregon.
Sources
- Crowd Counting Consortium, Ash Center, Harvard Kennedy School: project overview, data on Harvard Dataverse.
- "The Real Numbers: Tracking Crowd Sizes at Presidential Rallies", Ash Center, Aug 12, 2024: describes CCC's sources, mostly commercial news outlets and social media, and its coding guidelines.
- United States: Scope and coverage in ACLED data, ACLED.
- United States: ACLED conflict and demonstration events, Humanitarian Data Exchange (weekly, 2020 to present).
- "Tear gas fired again; Portland protest standoff continues", Associated Press, July 25, 2020.
- "Inside the Battle for Downtown Portland", The New York Times, July 31, 2020.
- "Portland police crack down fast on protesters Saturday night", OPB, Sept 6, 2020 (the 100th night of protests).
--h
Questions or corrections? Write me at .
How we computed it.
- Events: in-person protests in the Crowd Counting Consortium's public event data (Harvard Dataverse), 2020–25, where any injury or property damage was reported.
- Rate: events per 100,000 residents per year, using Census Bureau population estimates. The 2021–25 rate leaves out 2020.
- Portland: Oregon's rank without Portland drops Portland's events and population.
- Correlations: Spearman rank correlations across the 50 states with our Safety pillar, our overall ranking, urban share and FBI disorderly-conduct arrests.
- These are correlations, not causes.