Oregon schools
Oregon Spent 89% More on Schools. Scores Fell to 45th.
Oregon's per-pupil school spending rose 89% from FY2013 to FY2024 (about 41% after inflation), and its NAEP Schools rank fell from 31st to 45th. The problem isn't how much Oregon spends. It's where the money goes: 55% reaches the classroom, vs. 59% nationally.
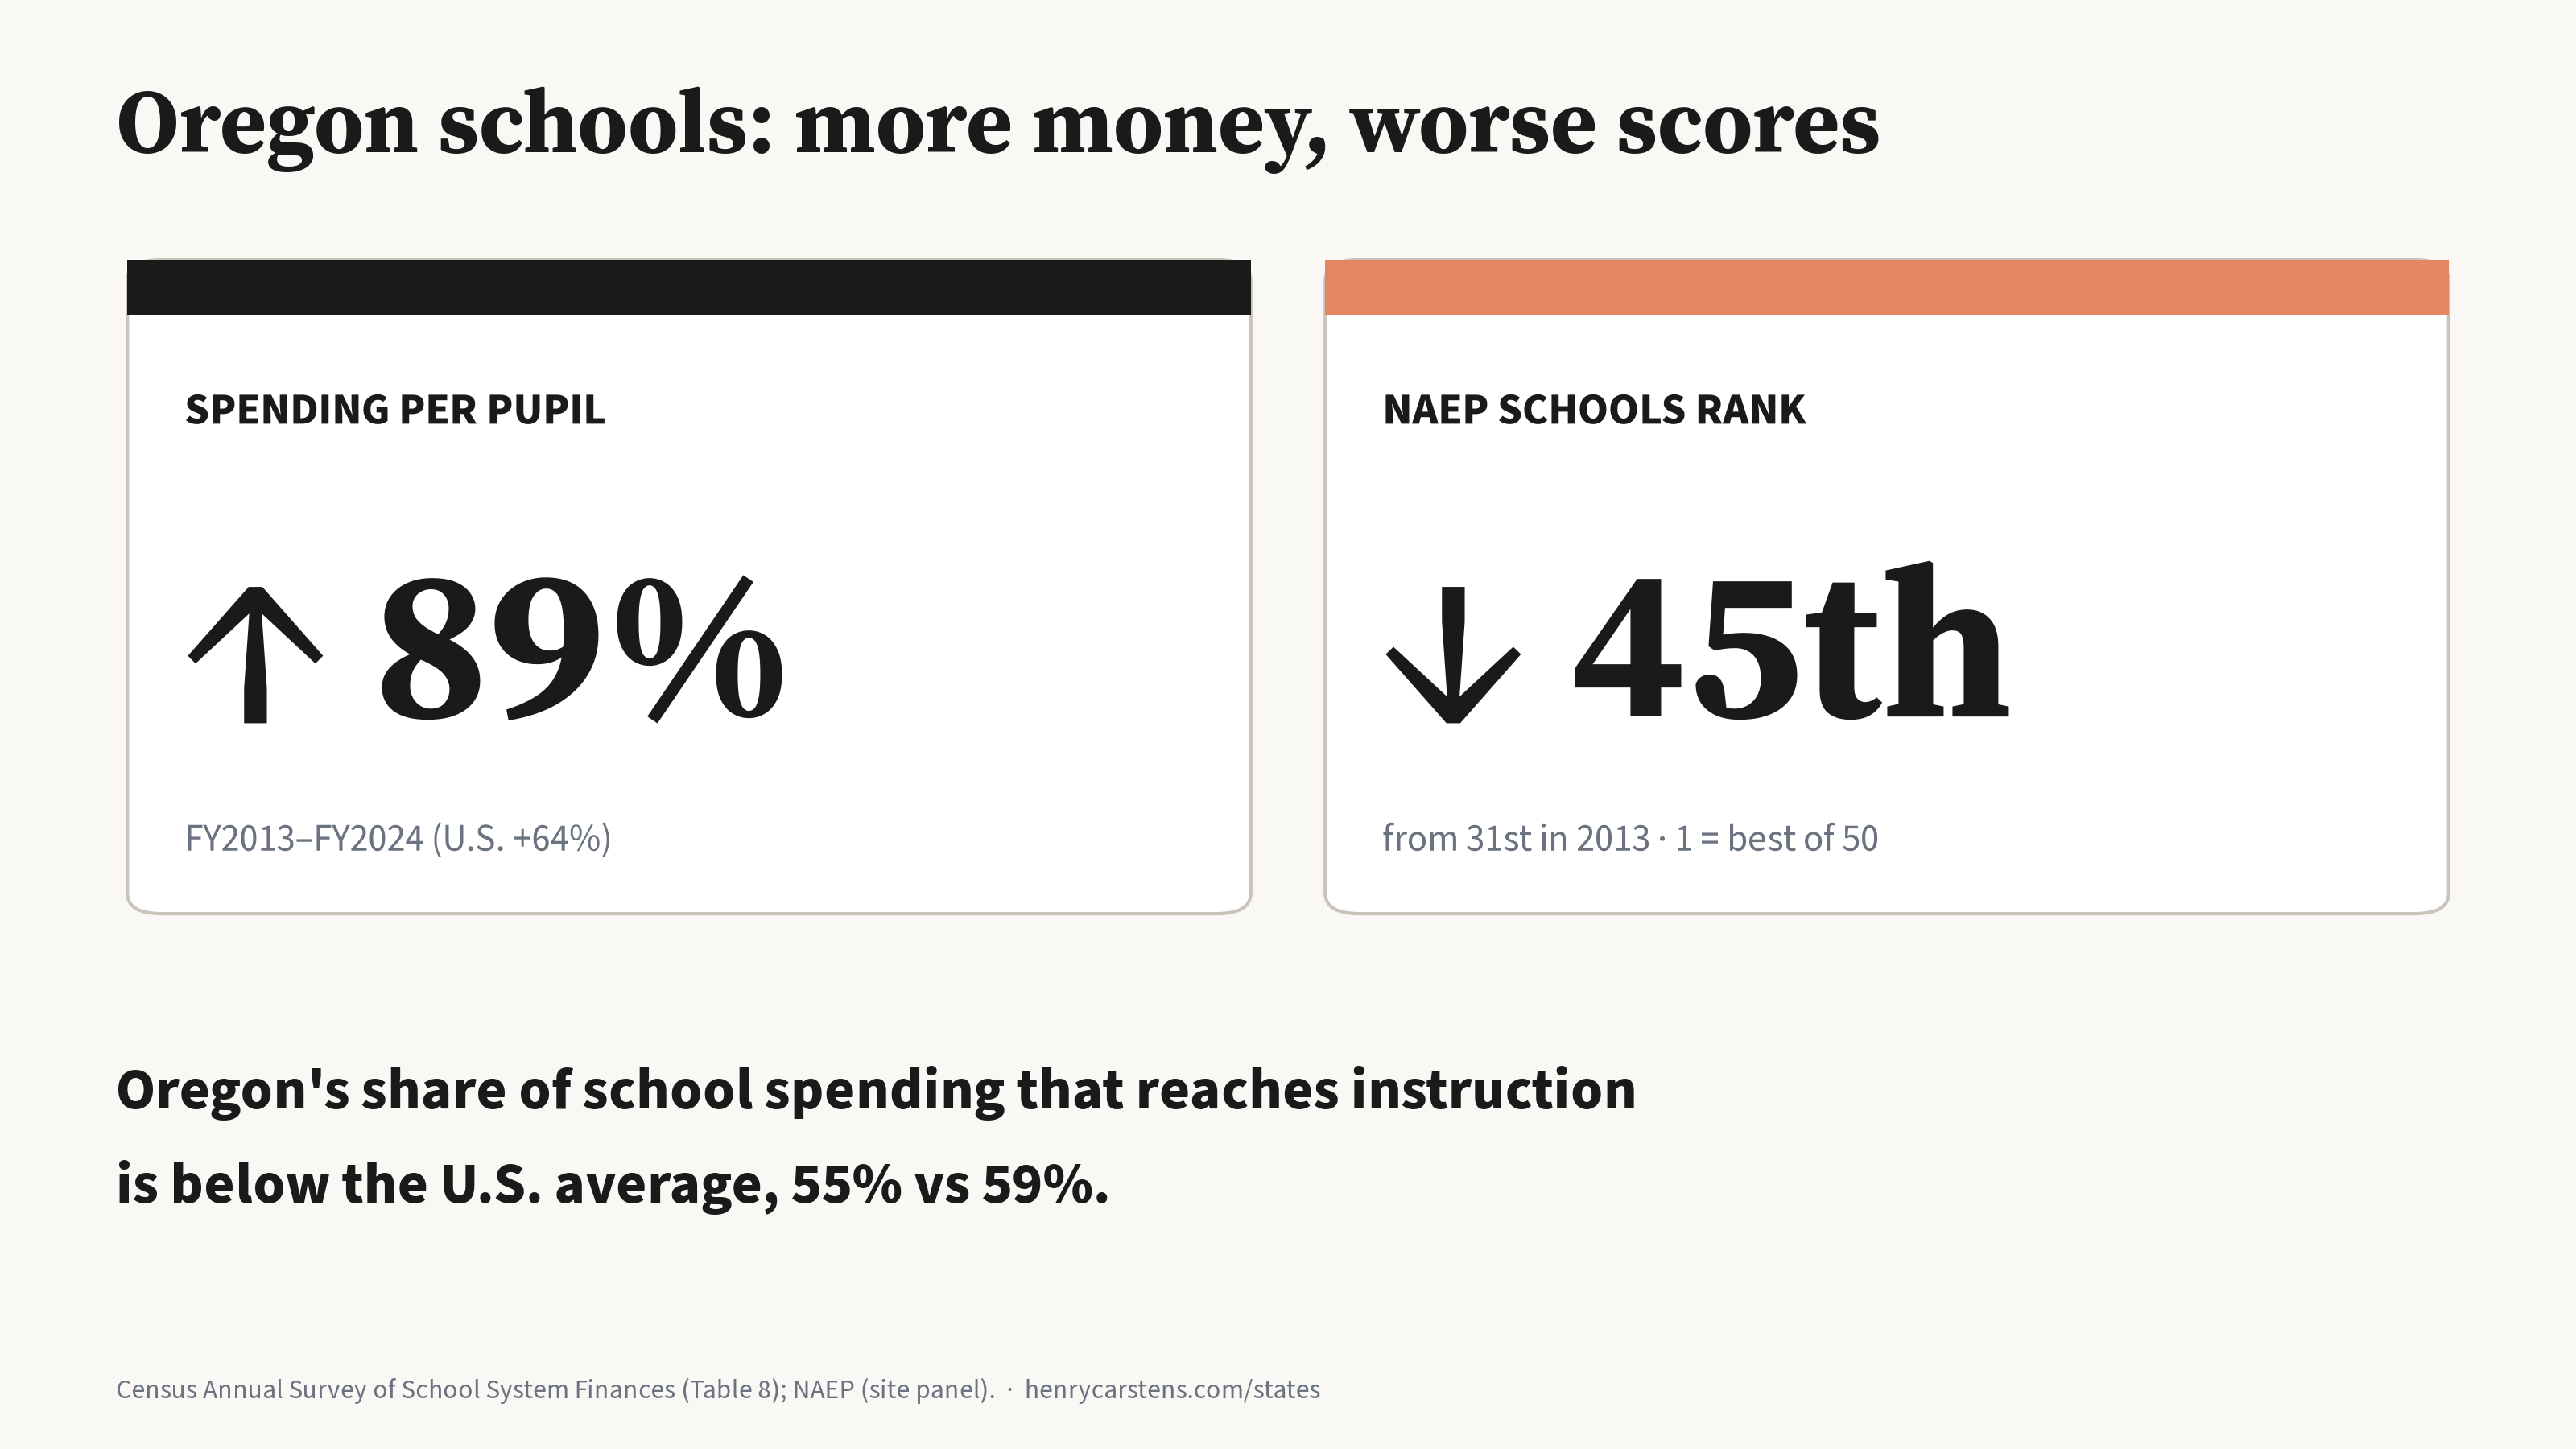
The problem isn't how much Oregon spends on schools. It's where the money goes.
The money went up
In FY2013 Oregon spent $9,543 per pupil, 89% of the U.S. average and 31st of 50 states, excluding DC. By FY2024 it spent $18,083, a bit above the U.S. figure of $17,619. That's 19th of 50 states, excluding DC, or 23rd after adjusting for living costs. Spending grew 89%, the 5th-fastest rise in the country. The U.S. grew 64% (Census Annual Survey of School System Finances). After inflation, that's about 41% (U.S. 22%), per BLS CPI-U.
The scores went down
Over the same years, Oregon's average across the four national tests (NAEP: reading and math in grades 4 and 8) fell 13.2 points. The average state fell 8.4. Only four states lost more. The Schools rank went from 31st to 45th. Adjusted for poverty, language and special education, Oregon is last in both 4th-grade tests (Urban Institute, 2024).
Other states show money alone isn't the problem. Ohio, Minnesota and Wisconsin spend within 10% of Oregon and rank 9th, 10th and 11th.
Where the money goes
Oregon spends 55% of its school dollars on instruction. The U.S. spends 59%. In dollars, that's $9,951 per pupil in Oregon vs. $10,346 nationally, less in the classroom despite more in total. Employee benefits take 29% of Oregon's spending vs. 24% nationally (Census, Table 8).
Classroom vs. everything else, per pupil (FY2024)
| Oregon | Share | U.S. | Share | Oregon vs. U.S. | |
|---|---|---|---|---|---|
| Instruction (classroom) | $9,951 | 55.0% | $10,346 | 58.7% | −$395 −3.7 pts |
| Everything outside the classroom | |||||
| Student support counselors, nurses, psychologists, attendance | $1,708 | 9.4% | $1,229 | 7.0% | +$479 +2.5 pts |
| Instructional staff support coaches, training, libraries | $827 | 4.6% | $916 | 5.2% | −$89 −0.6 pts |
| General (district) administration | $277 | 1.5% | $351 | 2.0% | −$74 −0.5 pts |
| School administration principals' offices | $1,149 | 6.4% | $946 | 5.4% | +$203 +1.0 pts |
| Operations and maintenance | $1,434 | 7.9% | $1,685 | 9.6% | −$251 −1.6 pts |
| Transportation | $843 | 4.7% | $756 | 4.3% | +$87 +0.4 pts |
| Other business and central services, food service, etc. | $1,894 | 10.5% | $1,391 | 7.9% | +$503 +2.6 pts |
| Total | $18,083 | 100% | $17,619 | 100% | +$464 |
It isn't the district office. Oregon spends less than the U.S. on central administration, buildings and teacher support. Its extra overhead sits in student support (+2.5 points, about $244M a year), "other" business and non-instructional services (+2.6 points, about $255M) and school offices (+1.0 point, about $97M). Some of that student support is real help for kids, so the $216–364M shift would mean hard choices about support staff and central services, not just trimming bureaucrats.
The rules got looser
- No graduation test. The Essential Skills requirement was suspended in 2021 and extended through 2027–28 (ODE). The class of 2025 set a record 83% graduation rate while tested skills fell.
- No zeros. Portland's grading guide says to give 50–60 instead of a zero, accept late work without penalty, and leave homework out of grades (REL Northwest, 2025). Stricter graders produce bigger test gains (Figlio & Lucas 2004).
- Short school year. Oregon ranks 47th in school hours (Kraft, testimony to the House Education Committee, 2026).
- Empty seats. 38% of students were chronically absent in 2022–23, the 4th-worst rate in the nation (AEI). It was still 33.5% in 2024–25.
- Few consequences. The Secretary of State found that ODE's failure to step in was "a larger problem than infringement on local control" (2022).
What about curriculum? It's untested, not proven. Oregon doesn't publish how many minutes classrooms spend on reading and math. Ethnic studies standards start in 2026–27, after the decline. Nobody tracked who used the 2021 equity-in-math guidance.
The fix: repurpose, don't add
Shift about $216–364M a year from overhead into classrooms (raising the classroom share from 55% to the national 59%).
The math (my estimate):
- At the national share, 58.7% × $18,083 = $10,618 per pupil for instruction. That's $667 more per pupil than today's $9,951.
- Times 545,641 students, that's about $364 million a year, from money already spent.
- A stricter benchmark, matching the U.S. instruction dollars ($10,346), frees $395 per pupil, or about $216 million.
What it buys:
- Tutoring for 1 in 5 K–8 students: about 75,600 students at $1,200–$2,500 each (National Student Support Accelerator) is $91–189 million. I estimated K–8 enrollment at 9/13 of the total.
- The rest goes toward more school hours. I estimate 10% more time at about $543 million a year, at 10% of instruction spending, so the freed money covers a third to two-thirds of it.
- Attendance work is mostly staff time.
| Estimate | |
|---|---|
| Costs | $216–364M a year moved out of non-classroom spending. Some of it is benefits and pension costs that can't be cut quickly, so expect years of bargaining and budget fights. |
| Benefits by NAEP 2030 | Tutoring 1–2 places; attendance 1–2; hours 0–2. Add a reading push with a 3rd-grade gate, plus real accountability, and the total is 2–7 places (to about 38th–43rd). Most of the payoff is in the 2030s. |
| Net | No new tax dollars. Up to 7 places by 2030, more later. The price is political, not fiscal. |
Effect sizes are from the studies listed below. Mississippi climbed with a reading law, coaches and a 3rd-grade gate, not a spending surge.
Classroom share isn't the whole story. The top 10 Schools states average 58.7% of spending on instruction, the same as the U.S., and range from 53% to 64%. Indiana (6th) matches Oregon's 55%. So classroom share alone doesn't explain Oregon's 45th place. It's one lever among several, alongside focus on reading, writing and math, and accountability (Census Annual Survey of School System Finances, FY2024, Table 8).
Read next
- How to Fix K-12: Earn the Next Grade, Then Pick a Real Path: the 3rd-grade gate and Mississippi.
- How long until the bottom 10 get back up?: big Schools climbs take 7–13 years.
- How long will it take Oregon to recover? and A Five-Year Plan for Oregon.
- Oregon's Health Plan Would Push Portland's Top Tax Rate Over 60%, Highest in America: why "repurpose" beats "raise."
Sources: BLS CPI-U (all urban consumers, U.S. city average, annual averages); Census Annual Survey of School System Finances FY2013 and FY2024 (Tables 8 and 19); NAEP state results (site panel); Urban Institute, States' Demographically Adjusted Performance on the 2024 NAEP; ODE Essential Skills page and graduation release (Jan. 29, 2026); REL Northwest, PPS Equitable Grading Practices Continuum (2025); LPRO, How Oregon Defines Instructional Time (2026); AEI Return to Learn Tracker; Oregon Audits Division report 2022-16; National Student Support Accelerator, Developing a Budget; Figlio & Lucas 2004; Nickow, Oreopoulos & Quan 2020; Liu, Lee & Gershenson 2021; Kraft & Novicoff 2024; Westall & Cummings 2023; Dee & Jacob 2011. FY2024 function breakdown from Census Tables 7–8.
--h
Questions or corrections? Write me at .