Oregon in Four Years · Part 3
Oregon in Four Years, Part 3: Schools. The Test Comes Too Soon
Oregon's Schools rank is 45th today, and my central forecast for the 2030 national test (NAEP) is 45th under either candidate. Kotek's plan is about a quarter of a place ahead with Democrats in control. Drazan's is slightly ahead if Republicans win a chamber.
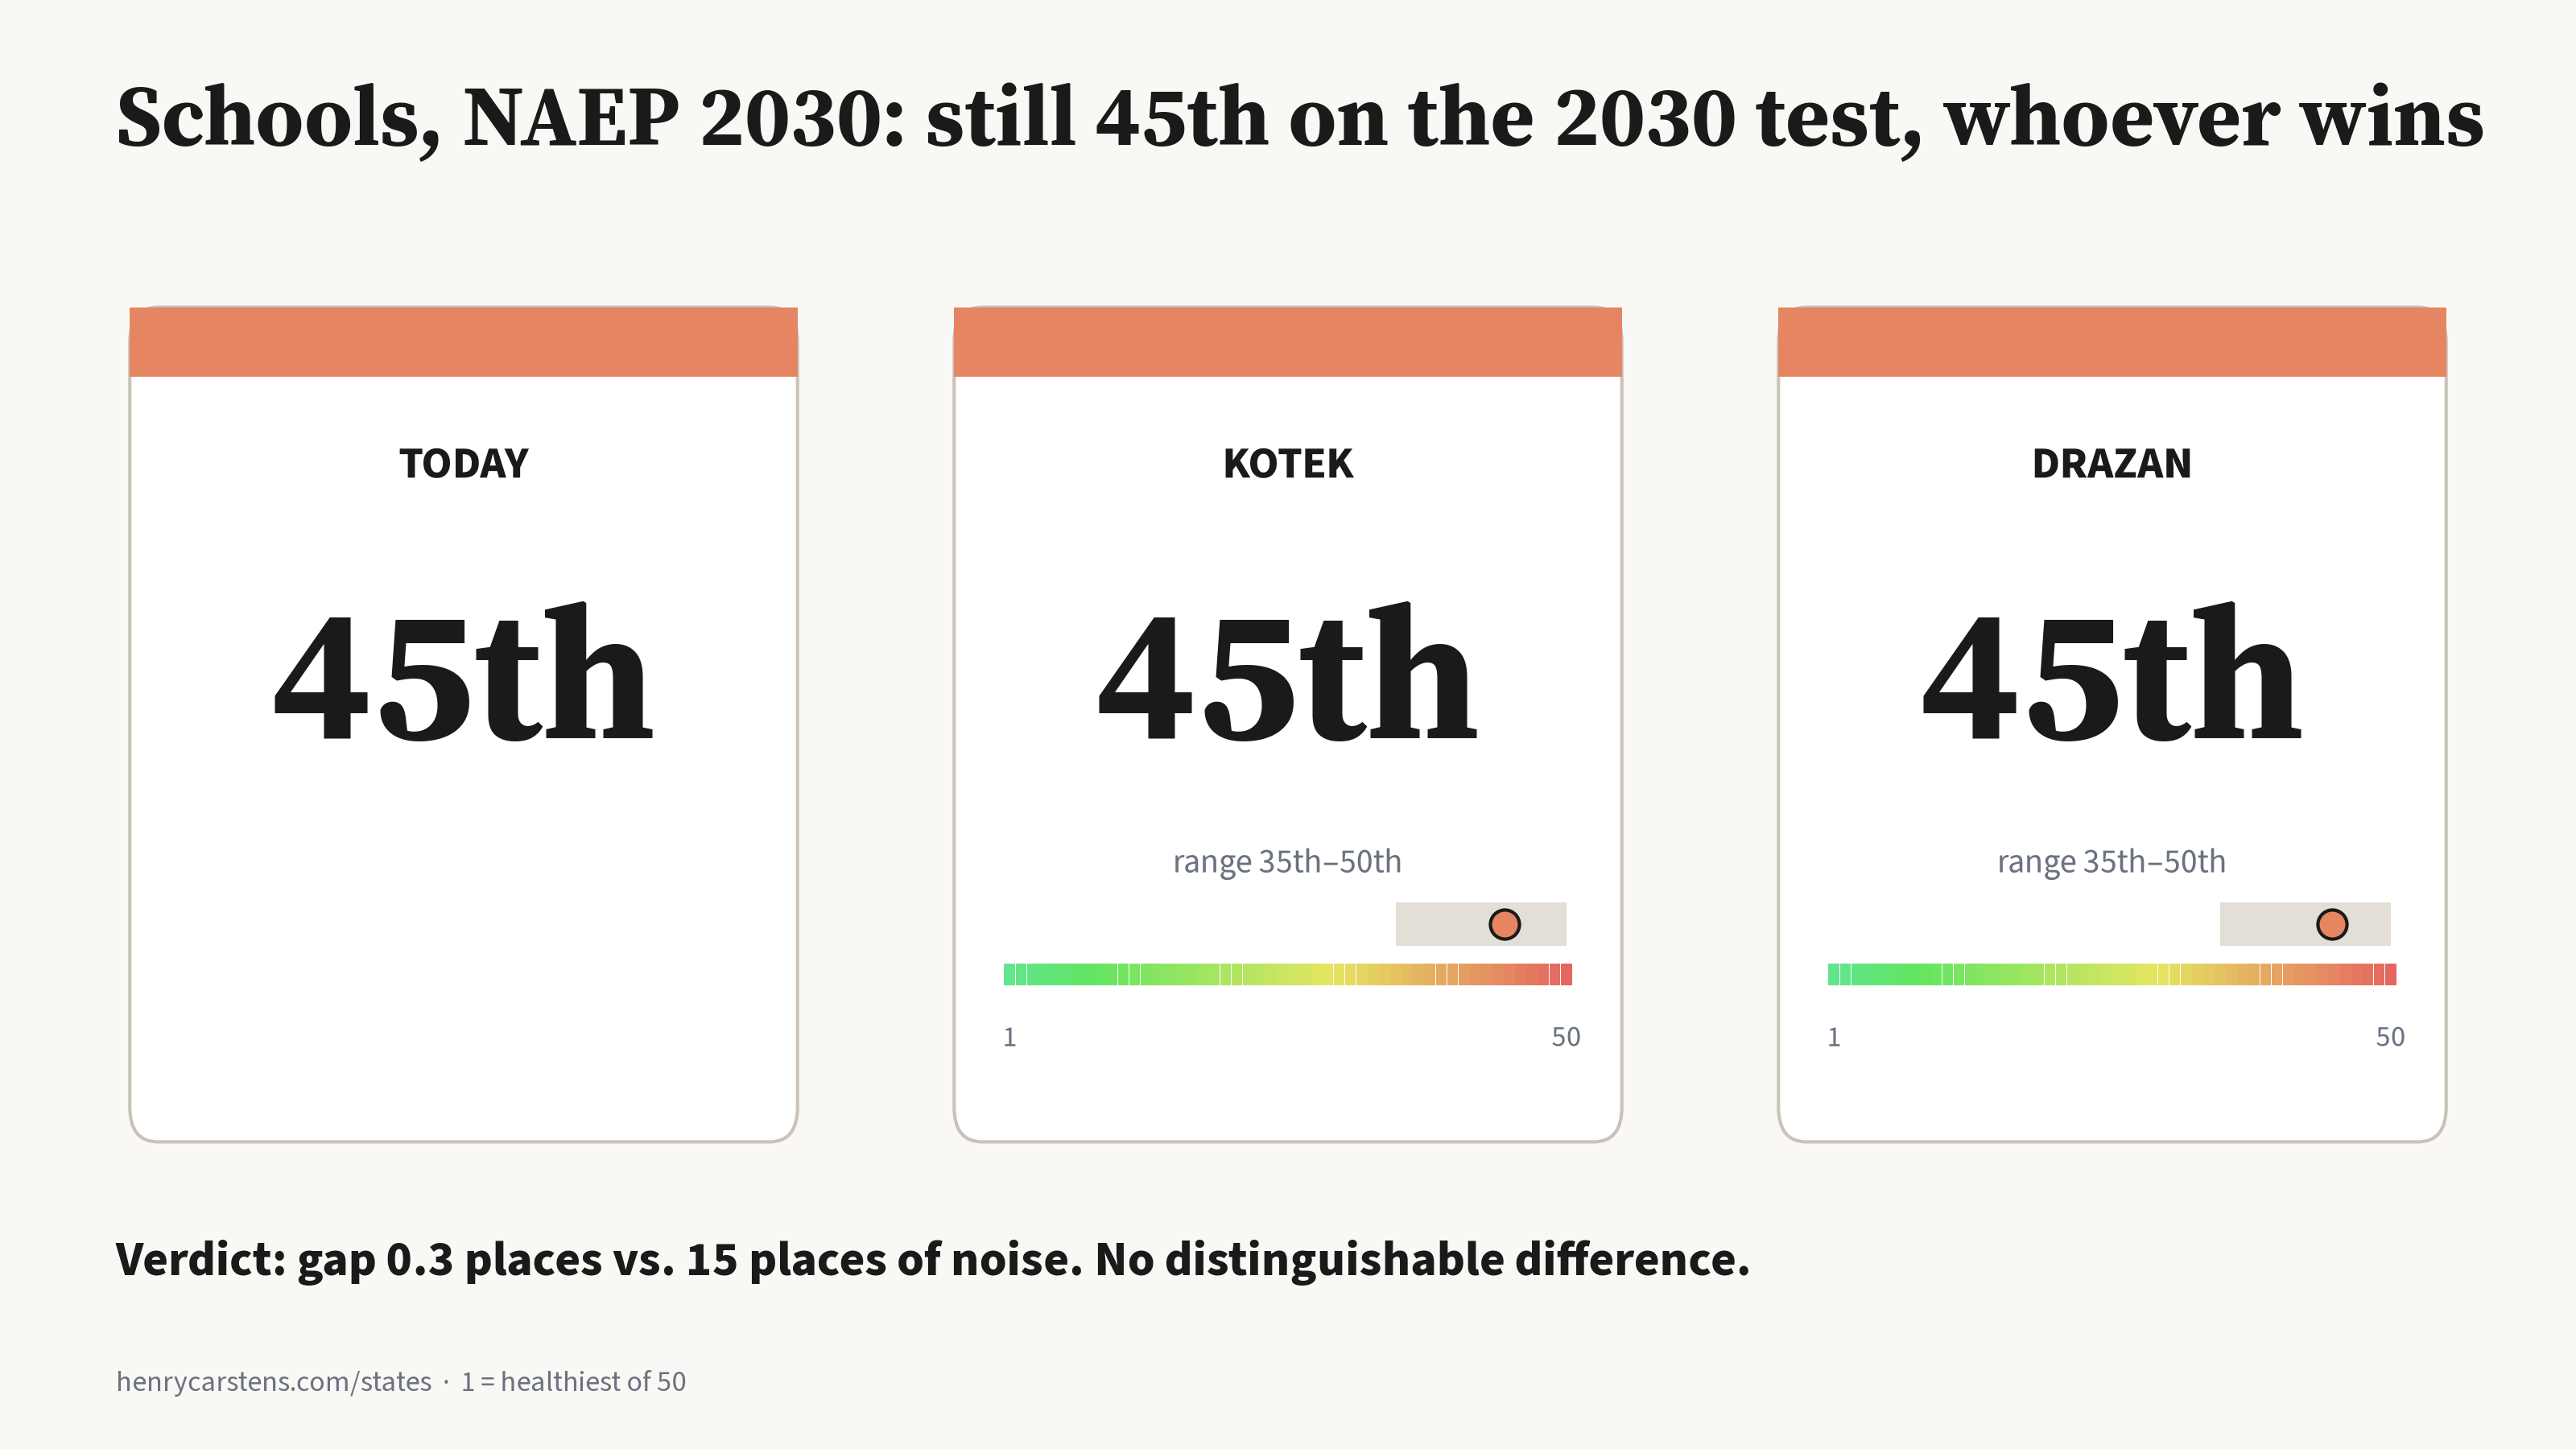
Bottom line: Oregon's Schools rank is 45th today, and my central forecast for the 2030 national test (NAEP) is 45th under either candidate. Kotek's plan is about a quarter of a place ahead with Democrats in control. Drazan's is slightly ahead if Republicans win a chamber. Either way the gap is under 1 place, against 15 places of noise. No distinguishable difference by 2030. What they set in motion for 2032 and later is a different question, and it's the one that matters.
Start from what this site already said
The K-12 piece and the bottom-10 clock both found that the biggest Schools climbs took 7 to 13 years. The five-year plan put it plainly: "Jobs decides whether Oregon is in the bottom 10 next year. Schools decide where it is in ten." And: "Five years won't bring it back to the middle." So the null hypothesis is a shared baseline of 45th. A candidate gets credit only for a lever that can reach the students tested in early 2030.
Today's baseline
- Schools: 45th (NAEP 2024, the average of Oregon's ranks in 4th- and 8th-grade reading and math).
- Oregon has been sliding for twenty years: 25th in 2003, 34th in 2019, 45th in 2024. It went from 1.5 points above the 50-state average to 5.6 points below.
- Oregon trails the 25th-ranked state by 7.7 points in 4th-grade reading, 9.1 in 4th-grade math, 2.5 in 8th-grade reading and 5.7 in 8th-grade math.
- 33.5% of students were chronically absent in 2024–25 (ODE report card). The graduation rate was 81.8% for the class of 2024.
- Oregon is one of the five states with the least instructional time (Kraft & Novicoff 2024).
Is it the money? Testing the pushback
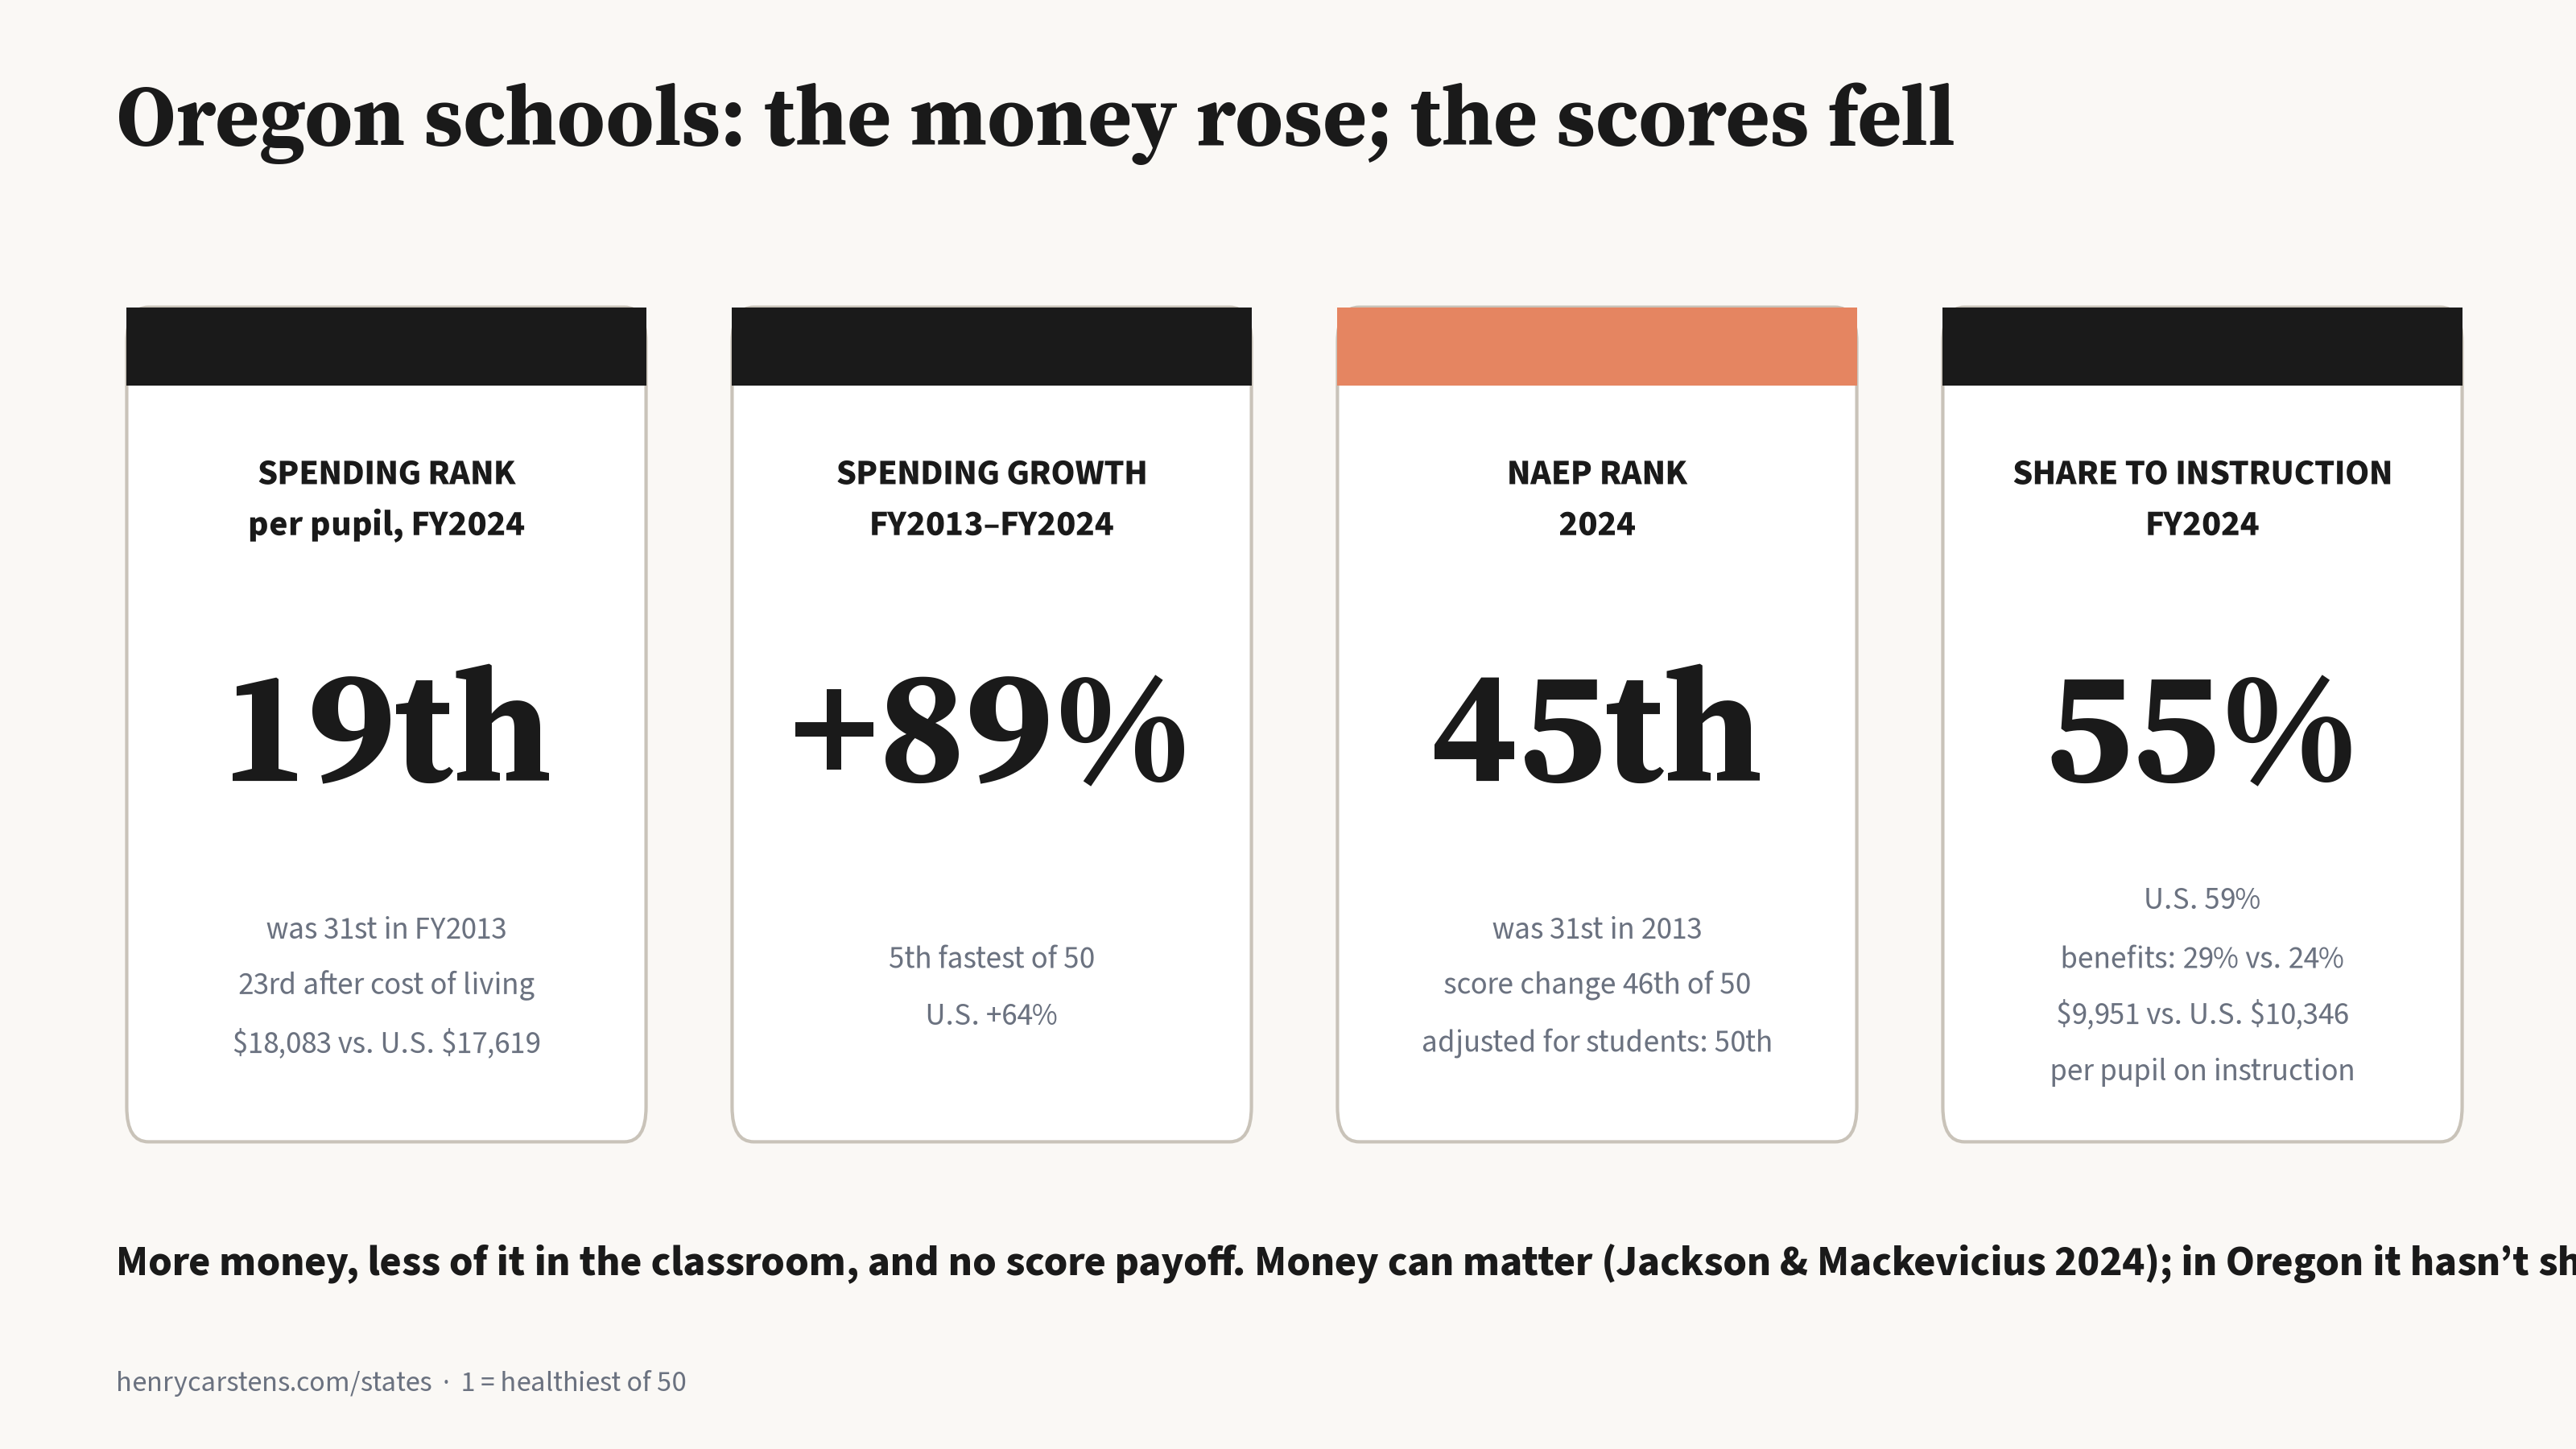
The objection: Oregon spends more per student than most states, and scores kept falling. Maybe the focus drifted from reading, writing and math, and nobody was held accountable. I tested each piece against the data. (The short version, with where the money goes line by line: Oregon Spent 89% More on Schools. Scores Fell to 45th.)
1. The money.
- Oregon spends a bit more than average now, but it didn't in 2013. In FY2024, current spending per pupil was $18,083, vs. $17,619 for the U.S. That's 19th of 50, and 23rd after adjusting for living costs (BEA price parities). In FY2013 it was $9,543, 89% of the U.S. figure, and 31st (Census Annual Survey of School System Finances, Table 8).
- Spending grew 89% from FY2013 to FY2024, the 5th-fastest rise in the country (U.S.: +64%; these figures are not adjusted for inflation).
- Scores fell faster than almost anywhere. Oregon's average across the four NAEP tests dropped 13.2 points from 2013 to 2024. The 50-state average dropped 8.4. Only four states lost more. The Schools rank went from 31st to 45th. Adjusted for student demographics, Oregon ranks last in both 4th-grade tests, 49th in 8th-grade math and 47th in 8th-grade reading (Urban Institute, 2024).
- Less of the money reaches the classroom. Oregon spends 55% of current spending on instruction, vs. 59% nationally. In dollars that's $9,951 per pupil, less than the U.S. $10,346, despite the higher total. Employee benefits take 29%, vs. 24% nationally, and they took 29% in 2013 too (Census, Table 8).
- Peers spend the same and score better. Sixteen other states spend within 10% of Oregon after cost adjustment. Ohio (9th), Minnesota (10th), Wisconsin (11th), Kentucky (20th) and Washington (21st) all rank far higher on NAEP. On demographically adjusted scores, Louisiana, Georgia and South Carolina all rank in the top 7. In all, 26 states spend less than Oregon and score better.
- But a raw comparison can't settle whether money matters. Across all 50 states, the change in spending from 2013 to 2024 has almost no correlation with the change in scores (0.05). That's true for every state, not just Oregon. The best causal studies, which follow the same districts before and after a funding change, still find that money helps on average: about +0.03 standard deviations per $1,000 sustained for four years (Jackson & Mackevicius 2024). The honest reading is that how Oregon spends matters more than how much. The +$1,000 lever is now heavily discounted (see the re-rank below).
- Timing matters too. From 2013 to 2019, Oregon's scores fell at about the national pace (29th of 50 on change). The big relative loss came in 2019–22, the 45th-best change. In 2020–21, Oregon was in remote learning for 59% of district-time, the 5th-highest share of 47 states (COVID-19 School Data Hub). States that stayed remote longer lost more (Jack, Halloran, Okun & Oster 2023, AER: Insights). Oregon still lagged from 2022 to 2024 (44th). The 2021 policy changes below landed in the same window, so the data can't separate the two causes.
2. Accountability.
- Graduation exit test: suspended. SB 744 (2021) suspended the Essential Skills test requirement for graduation. The State Board extended the suspension on Oct. 19, 2023, through 2027–28. ODE's reasoning was that the requirement was "not associated with college and career success" and "was implemented inequitably" (ODE FAQ). Meanwhile, the class of 2025 set a record 83.0% graduation rate, and 87.4% completed within five years. That five-year count includes GEDs, adult high school diplomas and extended diplomas (ODE, Jan. 29, 2026). Diplomas went up while tested skills went down.
- Grade promotion: no state rule. Oregon has no statewide retention law. HB 3440, a 2025 bill for a 3rd-grade reading gate, is not law. Portland's board policy treats holding a student back as something for "exceptional cases," to be "considered with caution and only if other strategies appear unlikely" to work (PPS policy 4.20.010-P).
- Grading: softer in places. ODE promotes "equitable grading" training modules (2021–22). Portland's practices guide, drafted with the federal research lab REL Northwest (Dec. 2025), says: no zeros (use 50–60 instead), accept late work without penalty, leave homework out of grades, and allow retakes. On the evidence: elementary students whose teachers grade harder gain more on standardized tests (Figlio & Lucas 2004, J. Public Econ.). No one has measured what Oregon's grading changes did to NAEP, so that link is untested.
- Time and attendance: among the worst. Oregon requires 900 hours a year in grades K–8 and sets no minimum number of days (OAR 581-022-2320). Kraft told the House Education Committee in January 2026 that Oregon ranks 47th in school hours. Chronic absence hit 38.1% in 2022–23, the 4th-worst in the nation (AEI Return to Learn Tracker). It was 33.5% in 2024–25, vs. about 23.5% nationally in 2024.
- The state rarely stepped in. The Secretary of State's 2022 review of six years of school audits concluded: "a lack of intervention by ODE, despite significant problems at the school and district level, has been a larger problem than infringement on local control." Releasing the December 2024 audit of Measure 98 (High School Success), the Secretary of State said that "without measurable data, it can be very difficult to determine impact."
- The new accountability law bites late. SB 141 (2025) sets district targets on seven measures, including 3rd-grade reading and 8th-grade math, starting in 2026–27. A district that misses its targets two years in a row gets mandatory coaching, first possible in 2028–29. After four missed years, ODE can direct up to 25% of the district's State School Fund grant, which is after NAEP 2030.
- Does accountability work? Yes, when it has consequences. No Child Left Behind raised 4th-grade NAEP math by about 7 points (0.23 standard deviations) by 2007 in states that had no accountability system before. It had no reliable effect on reading (Dee & Jacob 2011, JPAM). Mississippi's 3rd-grade gate came with intensive reading help. Students held back scored 1.2 standard deviations higher in 6th-grade reading than similar students who just passed, with no effect on math (Slungaard Mumma & Winters 2023). Across states, the 3rd-grade retention component explains most of the gains on state tests from early-literacy laws. On NAEP, though, gains show up only with comprehensive packages (Westall & Cummings 2023). Graduation exit tests are different: they cut graduation rates and do little for achievement (Holme et al. 2010). And NAEP tests grades 4 and 8 anyway.
3. Curriculum.
- Reading: Oregon has started. HB 3198 (2023) created the Early Literacy Success Initiative, which funds science-of-reading curriculum, coaching and tutoring. HB 3040 (2025) lets ODE require a district under a corrective plan to use the State Board's approved early-literacy materials. Otherwise, districts may still pick their own core materials through an "independent adoption" (OAR 581-022-2350). ODE points parents to EdReports to check whether their district's curriculum is well rated. No statewide count has been published of how many districts use highly rated materials. That number could be measured, and it should be.
- Math, 2021: ODE's February 2021 educator newsletter shared A Pathway to Equitable Math Instruction. ODE said it was optional professional learning, not a mandate. Nobody has measured how many teachers used it or what it did to scores. That's untested.
- Ethnic studies: HB 2845 (2017) folds ethnic studies into the K–12 social-science standards, required starting in 2026–27. That's after the 2013–24 decline, so it can't explain it. The best evidence on an ethnic-studies course found higher attendance and credits among San Francisco 9th graders (Dee & Penner 2017, AERJ), and later higher graduation (Bonilla, Dee & Penner 2021, PNAS).
- "Social justice instead of the basics": this is untested, not disproven. Oregon doesn't publish how many minutes elementary classrooms spend on reading and math. What can be measured: minutes on core subjects, curriculum ratings (EdReports), and the share of districts on the State Board's approved list.
Verdict on the hypothesis
| Claim | Verdict | Why |
|---|---|---|
| Oregon spends more than most states | Partly supported | True now (19th; 23rd cost-adjusted, +2.6% vs. U.S.), but not in 2013 (31st) |
| Spending rose while scores fell | Supported | +89% (5th fastest); scores −13.2 vs. −8.4 average |
| So more money won't help | Partly supported | Causal studies say money helps on average. Oregon's own record, and its low instruction share, say unconditional money is a weak bet here |
| Weak accountability | Supported | Exit test suspended, no grade gate, the state rarely stepped in (SoS 2022), short year, high absence; SB 141's consequences land after 2030 |
| Restoring the exit test would raise scores | Not supported | It changes diplomas, not grade 4/8 tests (Holme et al. 2010) |
| A 3rd-grade gate with reading support helps | Supported | Mississippi (Slungaard Mumma & Winters 2023); Westall & Cummings 2023 |
| Lenient grading lowers learning | Partly supported | Figlio & Lucas 2004 at the classroom level; untested for Oregon |
| Social-justice curriculum caused the decline | Untested | No measure of time shifted; ethnic-studies timing rules it out for 2013–24; the 2021 math resource was optional and its use was never measured |
What changes in this forecast: the Kotek–Drazan verdict stays the same. Drazan's reading gate and Kotek's time and attendance pledges were already in the model, and graduation requirements count as zero on NAEP for both. What changes is what it would take (below and in Part 5). The school levers are re-ranked, and raw money drops to the bottom tier.
The calendar decides most of this
NAEP tests reading and math in grades 4 and 8 every two years: 2026, 2028 and 2030 (NCES schedule, May 2026; 2027 and 2029 are science only). The 2026 results come out in winter 2027, so they grade the current term, not the next one. NAEP 2030 is the last reading of the next term, tested in early 2030 and released in fall 2030.
Who sits that test? The 4th graders of 2030 started kindergarten in fall 2025. The 8th graders were in 4th grade in 2025–26. A law passed in the 2027 session usually takes effect in the 2027–28 or 2028–29 school year. That gives it, at most, one to two years of reach into the 2030 test.
The trend if nothing changes
Carry-forward beat everything I tested for Schools. Across all states since 2003, three NAEP cycles of change landed within about ±10 places 80% of the time. For Oregon:
| NAEP | Central | 80% range |
|---|---|---|
| 2026 | 45th | 40th–50th |
| 2028 | 45th | 38th–50th |
| 2030 | 45th | 35th–50th |
Scale: +1 NAEP point on all four tests is worth about 2.5 places. +4 points would lift Oregon to about 37th.
What does real improvement look like? Mississippi is the case study. Its 4th-grade reading score rose from 208.5 (2013) to 219.3 (2019), about +11 points in six years. That's roughly a quarter of a standard deviation, assuming a standard deviation of about 40 points, which is an estimate based on NCES's 2022 grade-4 reading figure. Its Schools rank went from 50th to 26th by 2024. That took a reading law, coaches, a 3rd-grade gate and about a decade of staying the course.
What a governor controls on schools
More than on crime, but slowly. School funding runs through the State School Fund in each two-year budget, and the governor drafts it. The governor appoints the head of the Oregon Department of Education (ODE), and can direct ODE's rules and push accountability. But instructional-time rules, graduation requirements and promotion policy need the Legislature or the State Board. The teachers' union contracts are local. The research on governors and test scores: Leigh (2008) found 4th-grade reading +0.6 points under Democratic governors, with a standard error of 0.6, so a statistical zero. Dynes & Holbein (2020) found no party effect on attendance or diplomas. (They didn't test NAEP.)
The levers, steelmanned
Delivered effect = chance it passes × chance it's in place in time × effect size from a named study.
Kotek. Her strongest schools case: raise instructional time to the national average by the end of her second term; cut chronic absence with staff and real-time public attendance data; sustain and grow the literacy push (high-dosage tutoring, science of reading, summer programs); hold districts to performance standards; strengthen graduation requirements; and keep the school cellphone ban she already ordered. - More instructional time. Kraft & Novicoff (2024, AERJ) find that even 10% more time adds less than 0.05 standard deviations in U.S. schools. I assume Oregon needs 5–10% more hours to reach the national average, and that 25–50% of that is in place by the 2030 test. Her own deadline is 2031. Result: 0 to about +1 NAEP point. It's expensive and needs bargaining, so the chance it passes is 50% with a three-fifths Democratic Legislature and 30% if Republicans win a chamber. - Cutting absence. Liu, Lee & Gershenson (2021, J. Public Econ.): 10 absences cost about 0.03–0.04 standard deviations. I assume 0–2 fewer absences per student beyond the current trend. That's worth 0 to about +0.3 points. Most of this is executive work through ODE, so the chance is high (80%). - Graduation requirements: these change diplomas, not NAEP scores → 0.
Drazan. Her strongest schools case: end social promotion with a 3rd-grade reading gate; restore graduation requirements; a statewide standard for the school day (more classroom time); let teachers remove disruptive students; fund special education; cut ODE rules; parental rights; and opt Oregon into the federal scholarship tax credit, which Kotek declined in June 2026. - 3rd-grade reading gate. This was Mississippi's signature piece. But it would take until spring 2029 at the earliest to hold back the first class. I assume 0 to +5 points on 4th-grade reading only (that's at most half of Mississippi's six-year gain), or 0 to about 2.5 places. Two cautions. Holding kids back takes some low scorers out of the 4th-grade test pool, so part of any gain is mechanical. And a Democratic Legislature is unlikely to pass it: I give it a 10–20% chance, rising to 50% if Republicans win a chamber. Then there's only a 50% chance it's in place in time. - School-day standard: the same Kraft & Novicoff mechanism as Kotek's, at a lower chance of passing with a Democratic Legislature. - Scholarship tax credit: the governor can opt in alone, starting Jan. 1, 2027. The best voucher evidence (Abdulkadiroğlu, Pathak & Walters 2018, Louisiana) found early score losses for users. And a small program won't move statewide NAEP in three years → 0. - Removing disruptive students and cutting ODE rules: no measured statewide effect → 0.
Where they agree: early literacy (the Early Literacy Success Initiative, tutoring, science of reading), more instructional time, and tougher graduation standards. That shared ground is in the baseline for both. It's the part most likely to actually happen.
Headline forecast (NAEP 2030, costs and benefits netted)
| Legislature after Nov 3 | Kotek | Drazan | Gap (80% range) | Distinguishable? |
|---|---|---|---|---|
| Democrats keep 3/5 | 45th (44.6) | 45th (44.9) | Kotek +0.3 (−0.3 to +1.0) | No |
| Democrats keep majority only | 45th | 45th | Kotek +0.2 (−0.6 to +0.8) | No |
| Republicans win a chamber | 45th | 45th (44.5) | Drazan +0.1 (−0.6 to +1.3) | No |
The gap is less than a tenth of the 15-place noise band. No distinguishable difference in 2030.
What does move: the school levers, re-ranked
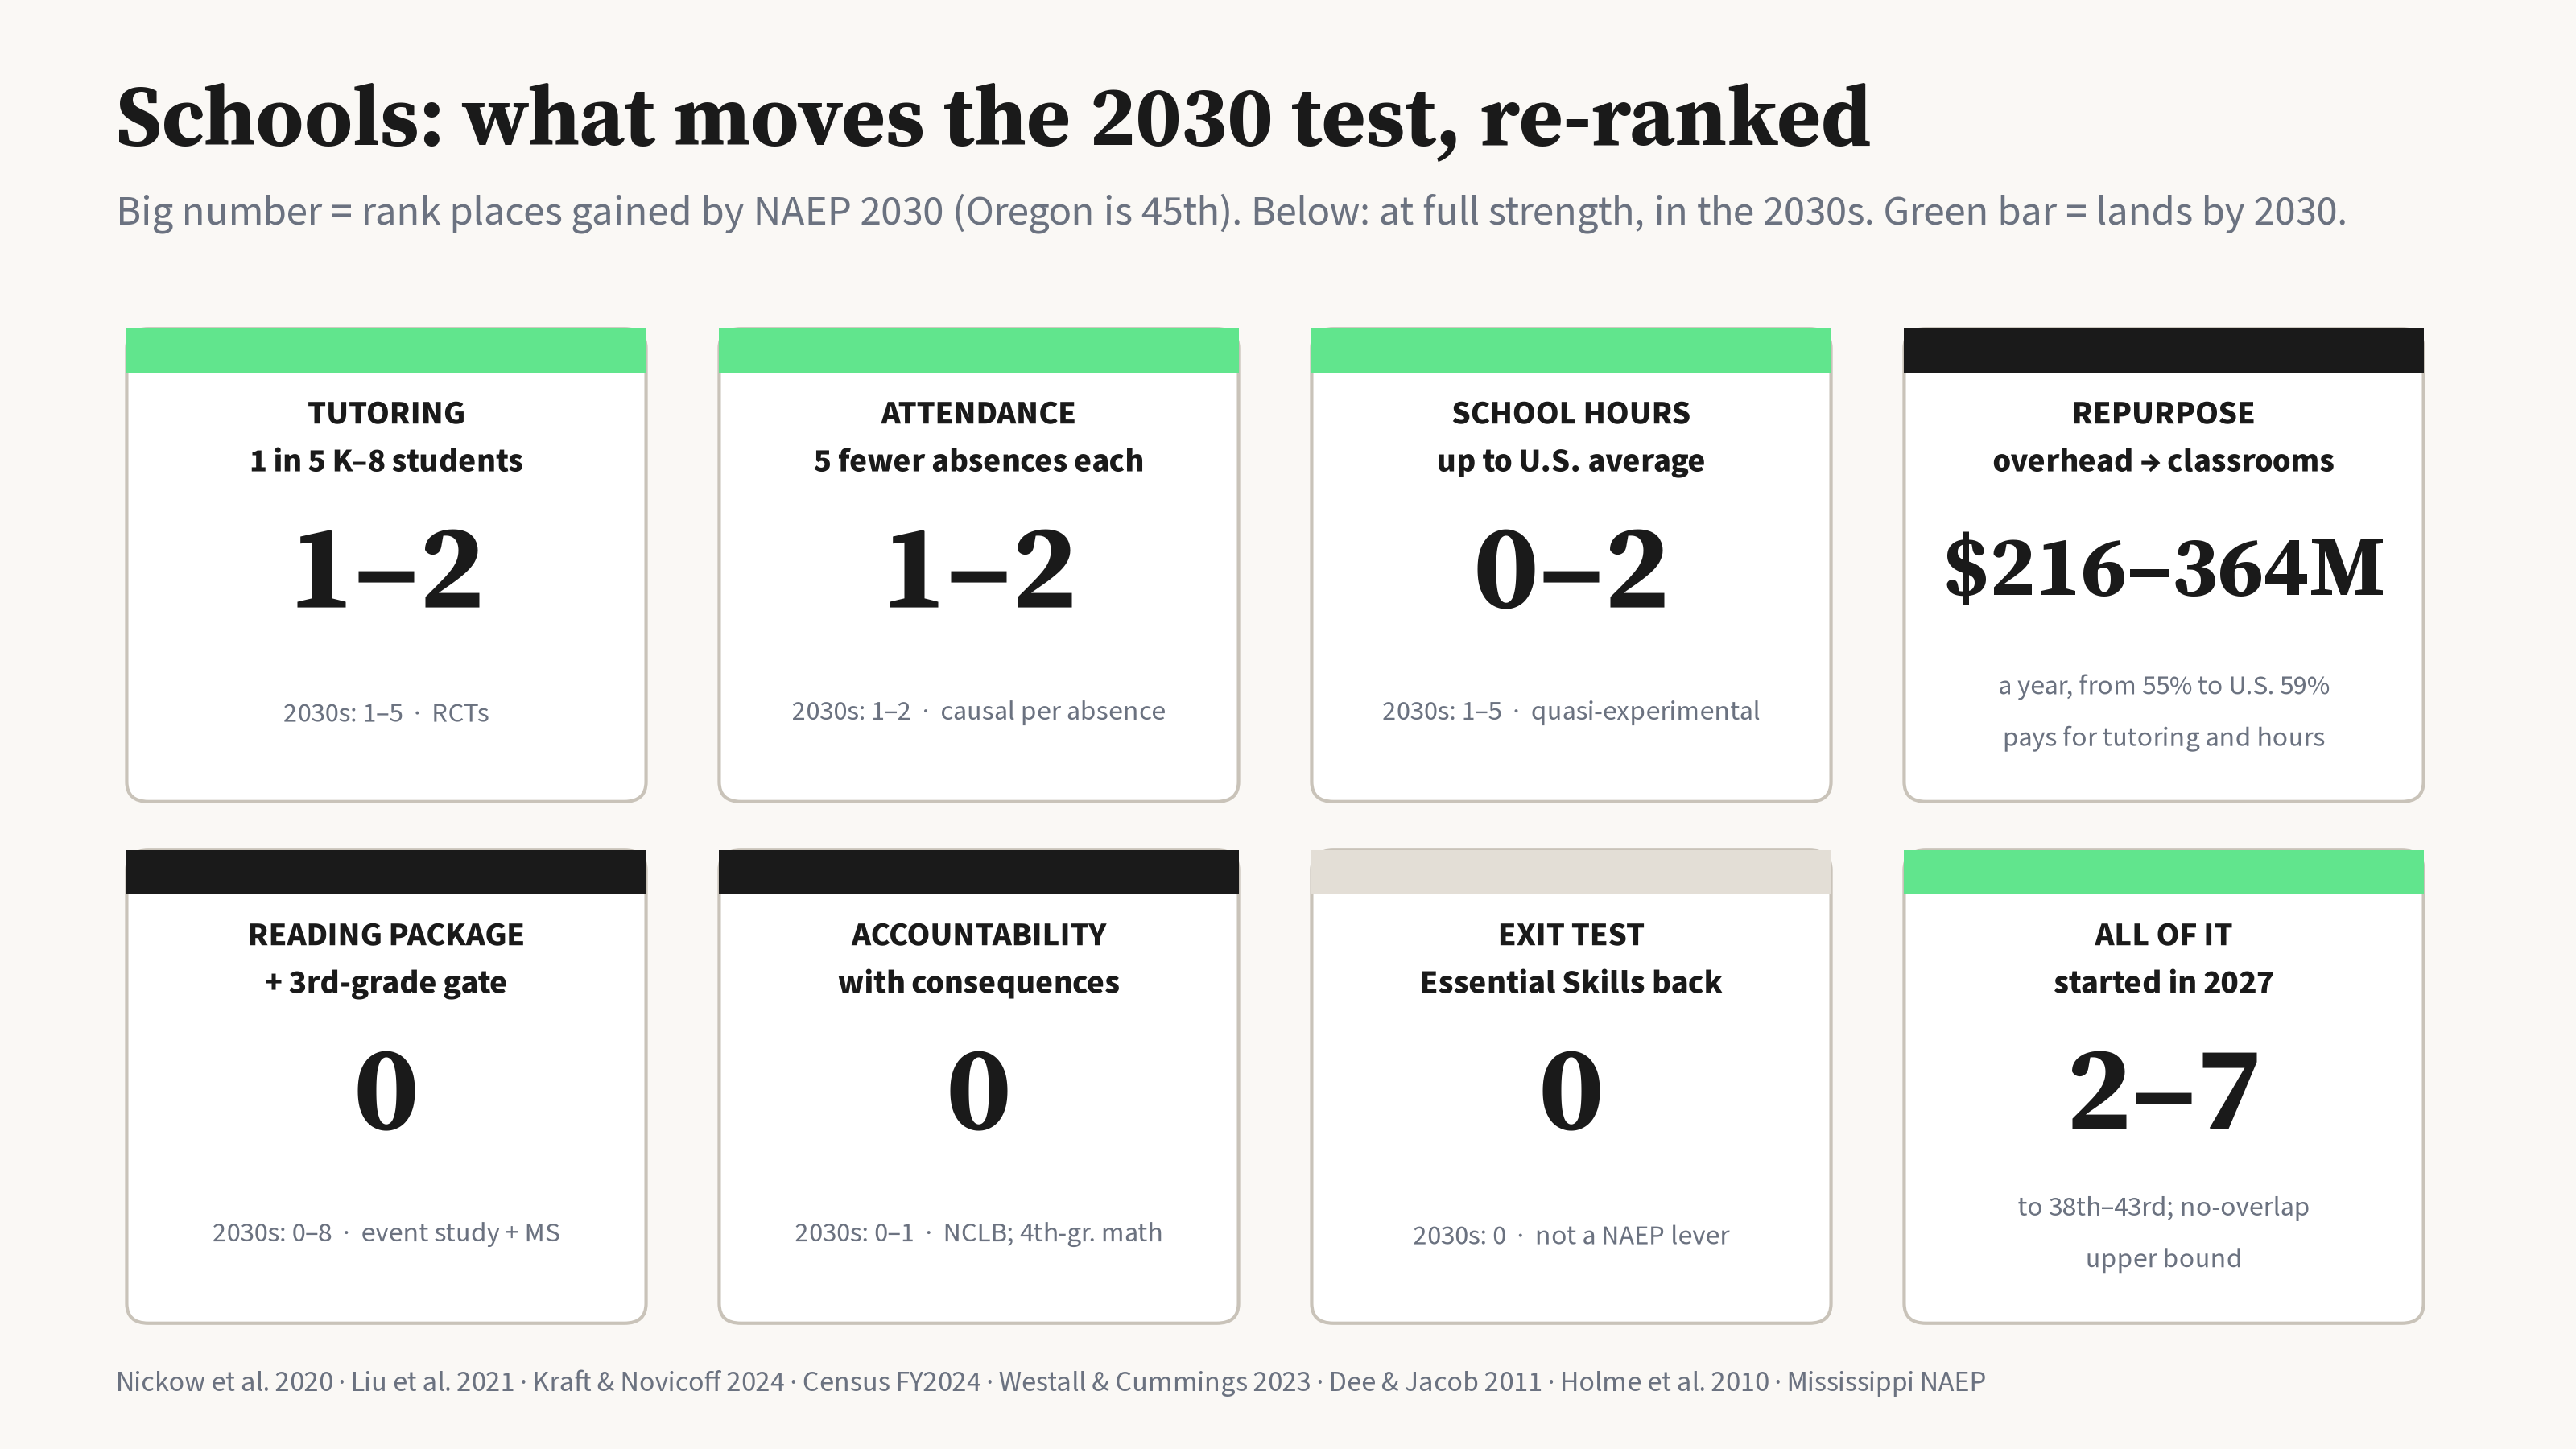
Places gained by NAEP 2030, with the full-strength 2030s effect in brackets. Oregon is 45th. +1 point on all four tests is worth about 2.5 places, and a gain on one test counts for about a quarter of that.
- High-dosage tutoring for 1 in 5 K–8 students: 1–2 (1–5). Strongest evidence: randomized trials pool to +0.37 standard deviations (Nickow, Oreopoulos & Quan 2020). I assume +0.10–0.20 at scale.
- 5 fewer absences per student: 1–2 (1–2). Each absence has a causal cost (Liu, Lee & Gershenson 2021), but no policy has proven it can cut 5 absences per student statewide.
- School hours up to the national average: 0–2 (1–5). Under 0.05 standard deviations for 10% more time (Kraft & Novicoff 2024). It can't be fully phased in by 2030.
- Repurpose, don't add: shift about $216–364M a year from overhead into classrooms (raising the classroom share from 55% to the national 59%). No new taxes. It isn't a separate score lever; it's how to pay for levers 1–3. New money with no strings has the weakest record in Oregon (spending up 89%, scores down). See Oregon Spent 89% More on Schools. Scores Fell to 45th.
- A full science-of-reading package with a 3rd-grade gate: 0 (0–8, the 8 at Mississippi's pace). The gate couldn't hold back the first class until spring 2029, and the full effect needs a cohort that started under it in kindergarten. At Mississippi's 2013–19 pace relative to other states (+9.4 points across all four tests), it would be much more than 8 places. That's the biggest prize, but in the 2030s.
- Accountability with real consequences: 0 (0–1). NCLB's +7 points was in 4th-grade math only. I assume Oregon gets 25–50% of that, since it already tests every year. SB 141's consequences start in 2028–29.
- Restoring the Essential Skills exit test: 0. It's about diplomas, not NAEP.
All of it, started in 2027: 2–7 places by 2030, to about 38th–43rd. That upper end assumes the effects don't overlap. Mississippi's lesson is the 2030s. It needed several of these levers at once (a reading law, coaches, a gate, and accountability), held for a decade.
Signposts to watch
- NAEP 2026 (out winter 2027). It resets the baseline before the new term even starts. A further drop makes 50th possible in the band.
- Oregon's 3rd-grade state reading scores (OSAS), spring 2028 and 2029. That's the earliest read on whether literacy money is landing.
- The share of students attending regularly (66.5% in 2024–25). Above 75% by 2029 would be real progress.
What would make this wrong
- Money. A recession, or the Medicaid hole from the 2025 federal law (more than $400 million over two years, per the Capital Chronicle), could squeeze the State School Fund under either governor. That would hurt both plans' time pledges.
- NAEP noise. Small sample changes and exclusion rates move single-cycle ranks by several places.
- The standard-deviation conversion. I used 35–40 points as an estimate. A different value shifts the small numbers but not the verdict.
- Other states. Most states have passed science-of-reading laws since 2013 (Education Week tracker). If they work, Oregon has to improve just to stay 45th.
Sources: NAEP state results 2003–2024 (site panel); Census Annual Survey of School System Finances FY2013, FY2019, FY2024 (Table 8); BEA Regional Price Parities 2019; Urban Institute, States' Demographically Adjusted Performance on the 2024 NAEP; COVID-19 School Data Hub (2020–21 learning model); Jack, Halloran, Okun & Oster 2023, AER: Insights; ODE Essential Skills page and Oct. 19, 2023 update; ODE cohort graduation release (Jan. 29, 2026); OAR 581-022-2320 and -2350; LPRO, How Oregon Defines Instructional Time (2026); AEI Return to Learn / Malkus 2025; Oregon Audits Division report 2022-16 and the Measure 98 audit (Dec. 2024); SB 141 (2025), HB 3198 (2023), HB 3040 (2025), HB 2845 (2017); PPS policy 4.20.010-P; REL Northwest, PPS Equitable Grading Practices Continuum (Dec. 2025); ODE Equitable Grading Practices page; ODE Feb. 2021 math newsletter; Dee & Jacob 2011, JPAM 30(3); Slungaard Mumma & Winters 2023; Westall & Cummings 2023, EdWorkingPaper 23-788; Figlio & Lucas 2004, J. Public Econ. 88; Dee & Penner 2017, AERJ 54(1); Bonilla, Dee & Penner 2021, PNAS 118(37); Jackson & Mackevicius 2024; Nickow, Oreopoulos & Quan 2020; NCES NAEP assessment schedule (May 15, 2026); ODE At-a-Glance State Report Card 2024–25; OSBA graduation release (class of 2024); Kraft & Novicoff 2024, AERJ 61(4), and Education Next (Winter 2025); Liu, Lee & Gershenson 2021, JPubE 199; Abdulkadiroğlu, Pathak & Walters 2018, AEJ: Applied 10(1); Holme et al. 2010, Review of Educational Research 80(4); Leigh 2008; Dynes & Holbein 2020; Education Week (June 2026) on Oregon's opt-out; Kotek 2026 platform PDF; The Drazan Plan.
Oregon in Four Years
- Oregon in Four Years, Part 1: Jobs. Who Wins Matters Less Than You Think
- Oregon in Four Years, Part 2: Safety. The Gap Is a Rounding Error
- Oregon in Four Years, Part 3: Schools. The Test Comes Too Soon (this page)
- Oregon in Four Years, Part 4: Will You Be Better Off?
- Oregon in Four Years, Part 5: What It Would Take
- Opinion: What Would Make This Election Matter to the Middle of Oregon
- Oregon Spent 89% More on Schools. Scores Fell to 45th.
--h
Questions or corrections? Write me at .