Oregon in Four Years · Part 2
Oregon in Four Years, Part 2: Safety. The Gap Is a Rounding Error
Oregon's Safety rank is 37th today, and my central forecast for the 2029 data is 37th under either candidate. The difference between them is a few hundredths of a place. The range of the noise is 18 places. No distinguishable difference.
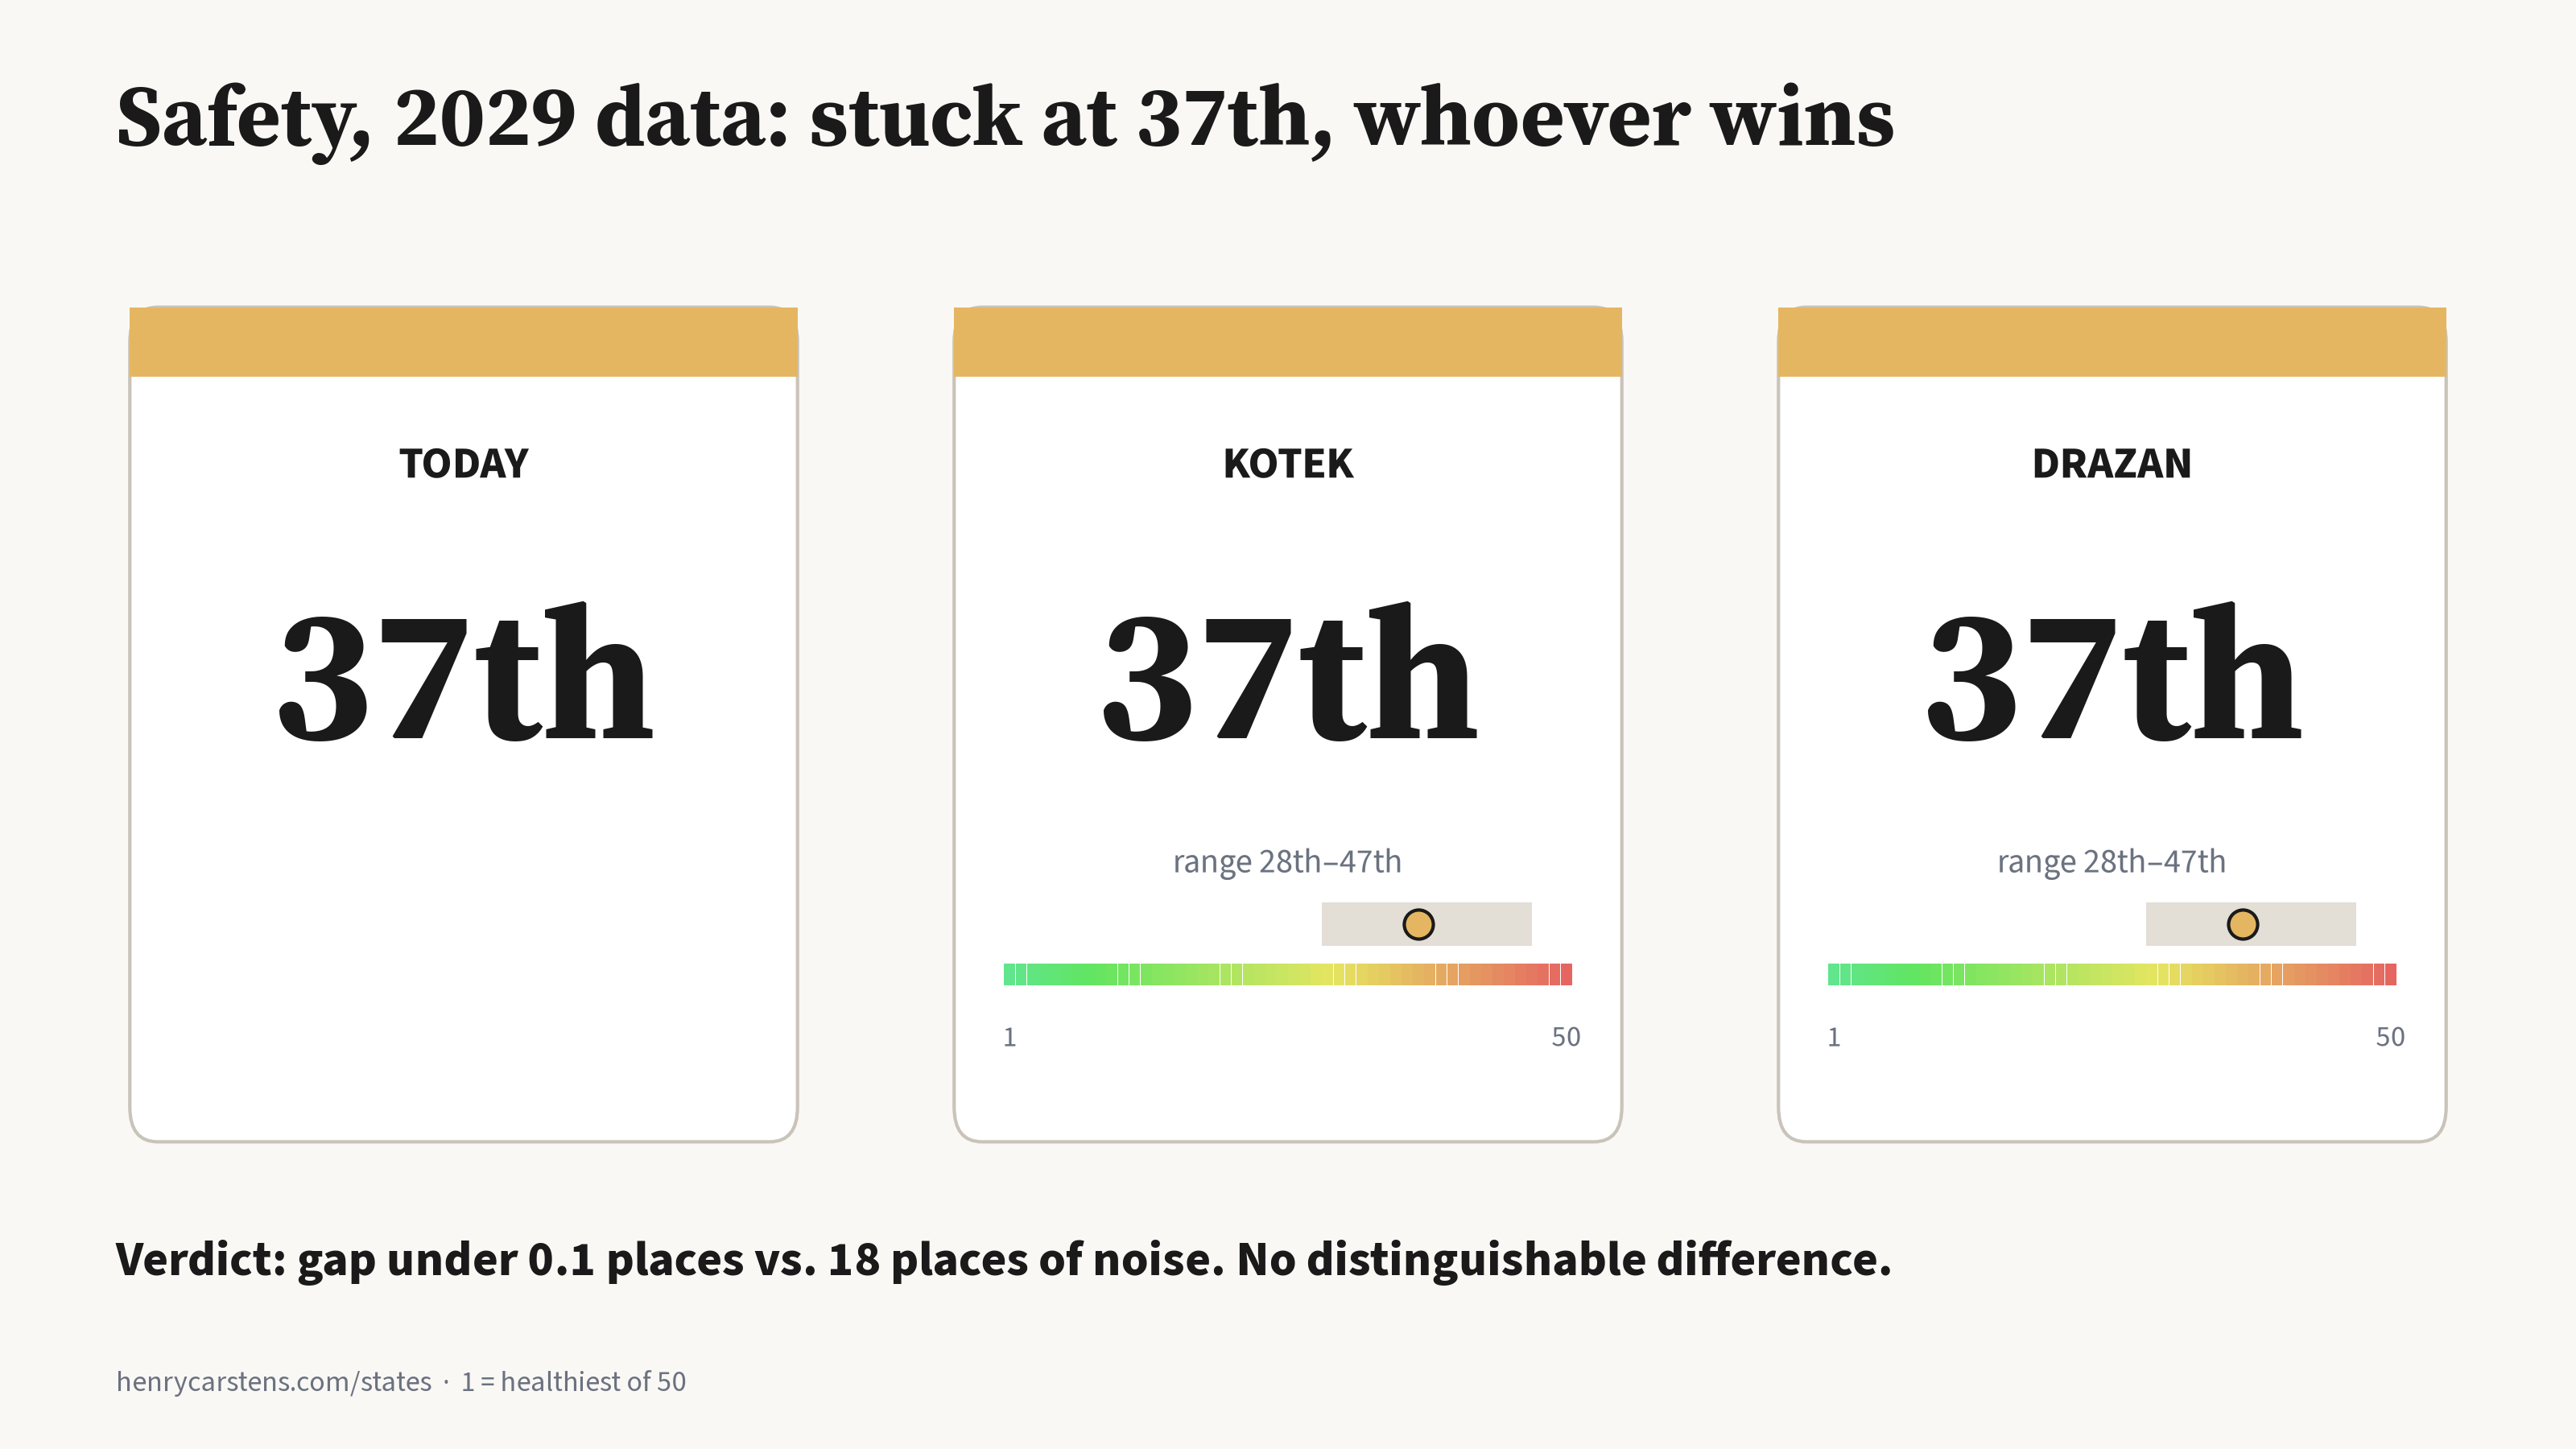
Bottom line: Oregon's Safety rank is 37th today, and my central forecast for the 2029 data is 37th under either candidate. The difference between them is a few hundredths of a place. The range of the noise is 18 places. No distinguishable difference.
Start from what this site already said
The five-year plan: "For Schools, Safety and the blended rank, nothing we tested beat 'it stays where it is' at that range." Safety is the stickiest thing I measure: 97% of a state's position carries into the next year. The recovery piece: "Schools and Safety shape where it can be in ten years." So the null hypothesis is that both candidates inherit 37th, and the burden of proof is on any lever that claims to move it.
Today's baseline
- Safety: 37th on the card (2024 FBI data, adjusted for reporting coverage). That's the average of two ranks. Violent crime is 27th (341 per 100,000). Property crime is 47th (2,453 per 100,000). Property crime is the drag.
- Oregon's property crime fell 18.9% from 2022 to 2024, and it still stayed 47th, because other states fell too.
- Nationally, crime is falling fast. In 2025, violent crime fell 9.3% and murder 18.1%. The murder rate (4.1 per 100,000) tied the record low (FBI, Aug. 14, 2026).
The trend if nothing changes
National baseline: crime keeps falling everywhere. Oregon's usual gap: high property crime, middling violence. Carry-forward wins on this measure, and the band widens slowly:
| Data year | Central | 80% range |
|---|---|---|
| 2025 | 37th | 33rd–41st |
| 2027 | 37th | 30th–45th |
| 2029 | 37th | 28th–47th |
(As in Part 1, these 80% ranges held 65–75% of the time in real-time tests.)
What it takes to move. With other states held where they are, Oregon needs about a 17% cut in property crime just to rise to 40th on property. Each 1% cut in property crime is worth about 0.3 places on the card. Each 1% cut in violent crime is worth about 0.15. If other states keep improving, the needed cut is bigger (the site's earlier estimate was about 27%).
What a governor controls on crime
Very little directly. Most policing is city and county. Prosecutors are elected locally. Sentencing changes need the Legislature, and Oregon voters often set sentencing themselves (Measure 11, Measure 110). The state controls the State Police, the prison and treatment budgets, and some grants to counties. The big recent change, HB 4002 (2024), made drug possession a crime again. Both candidates inherit it.
The research on governors and crime: - Leigh (2008), close elections: under Democratic governors, property crime was +56 per 100,000 (standard error 58, on an average of 3,782) and violent crime −6 (standard error 11). Both are statistical zeros. Incarceration was about 11 per 100,000 lower, also not significant in the close-election test. - Dynes & Holbein (2020): no party effect on property crime, violent crime or murder, at 4 years or 8.
The levers, steelmanned
Delivered effect = chance it passes × chance it's in place in time × effect size from a named study.
Drazan. Her strongest safety case: fully fund the State Police; a statewide addiction and mental-health emergency with recovery-first treatment; stop funding programs that "enable addiction"; tougher penalties for traffickers; audit homeless spending; help local cleanup of public spaces. - State Police. The best evidence on police and crime is Chalfin & McCrary (2018, Review of Economics and Statistics): each 10% more police cuts violent crime about 3.4% and property crime about 1.7%. Her plan doesn't say how many troopers. I assume up to 100 more sworn officers. That's my assumption, chosen to be generous. Oregon has about 5,637 sworn officers in all (FBI 2024 count, compiled by policecensus.com), the fewest per resident of any state, so 100 is +1.8%. Troopers mostly patrol highways, not the city blocks where property crime happens, so I count only 25–100% of the city effect. Result: property crime 0 to 0.3% lower. Chance it's funded: 60% with a Democratic Legislature, 80% if Republicans win a chamber. - Recovery-first treatment. Bondurant, Lindo & Swensen (2018, Journal of Urban Economics): each added treatment facility in a county cuts robbery about 0.11%, car theft 0.12% and burglary 0.05%. I assume 0 to 1 new facility per county, since much of her plan moves existing money around. - Tougher trafficking penalties: the National Research Council (2014) found longer sentences deter little → 0 on crime. This would raise prison counts, which is a cost, not a safety gain.
Kotek. Her strongest safety case comes through behavioral health. She has added 1,660 treatment beds and 45% more adult residential capacity. She promises more treatment and a bigger behavioral-health workforce, plus housing and homelessness programs. Her 2026 platform has no public-safety or policing section. Her "increase public safety funding" line was from a 2022 ad, so I count it as zero. - More treatment: the same Bondurant study, at 0 to 1.5 new facilities per county. Chance it passes: 80% with a three-fifths Democratic Legislature, 70% with a plain majority, 50% if Republicans win a chamber.
Where neither changes much: the big drivers of Oregon's property crime are local policing in Portland, car and retail theft rings, and national trends. Neither platform addresses those at a scale that matters. To gain 4 places on the card through policing alone, Oregon would need about 57% more police, statewide. Neither candidate proposes anything close.
Headline forecast (2029 data, costs and benefits netted)
| Legislature after Nov 3 | Kotek | Drazan | Gap (80% range) | Distinguishable? |
|---|---|---|---|---|
| Democrats keep 3/5 | 37th | 37th | Drazan +0.02 (−0.04 to +0.08) | No |
| Democrats keep majority only | 37th | 37th | Drazan +0.02 | No |
| Republicans win a chamber | 37th | 37th | Drazan +0.03 | No |
The gap is less than 1% of the 18-place noise band. No distinguishable difference. Even if every lever I credited were three times bigger, it would still round to zero.
What does differ (not in the rank)
- Prison and jail counts. Drazan's penalties would likely raise them. Leigh's close-election estimate is a modest gap (about 11 per 100,000), and it isn't statistically clear.
- Who gets treatment, and on what terms. Recovery-first vs. harm reduction changes overdose policy. Overdoses are a health measure, not part of my Safety rank, and I haven't forecast them here.
- Street disorder and visible homelessness. People feel these, but my rank doesn't measure them.
- Protest unrest: see the next section.
Protest unrest: does Oregon stay #1?
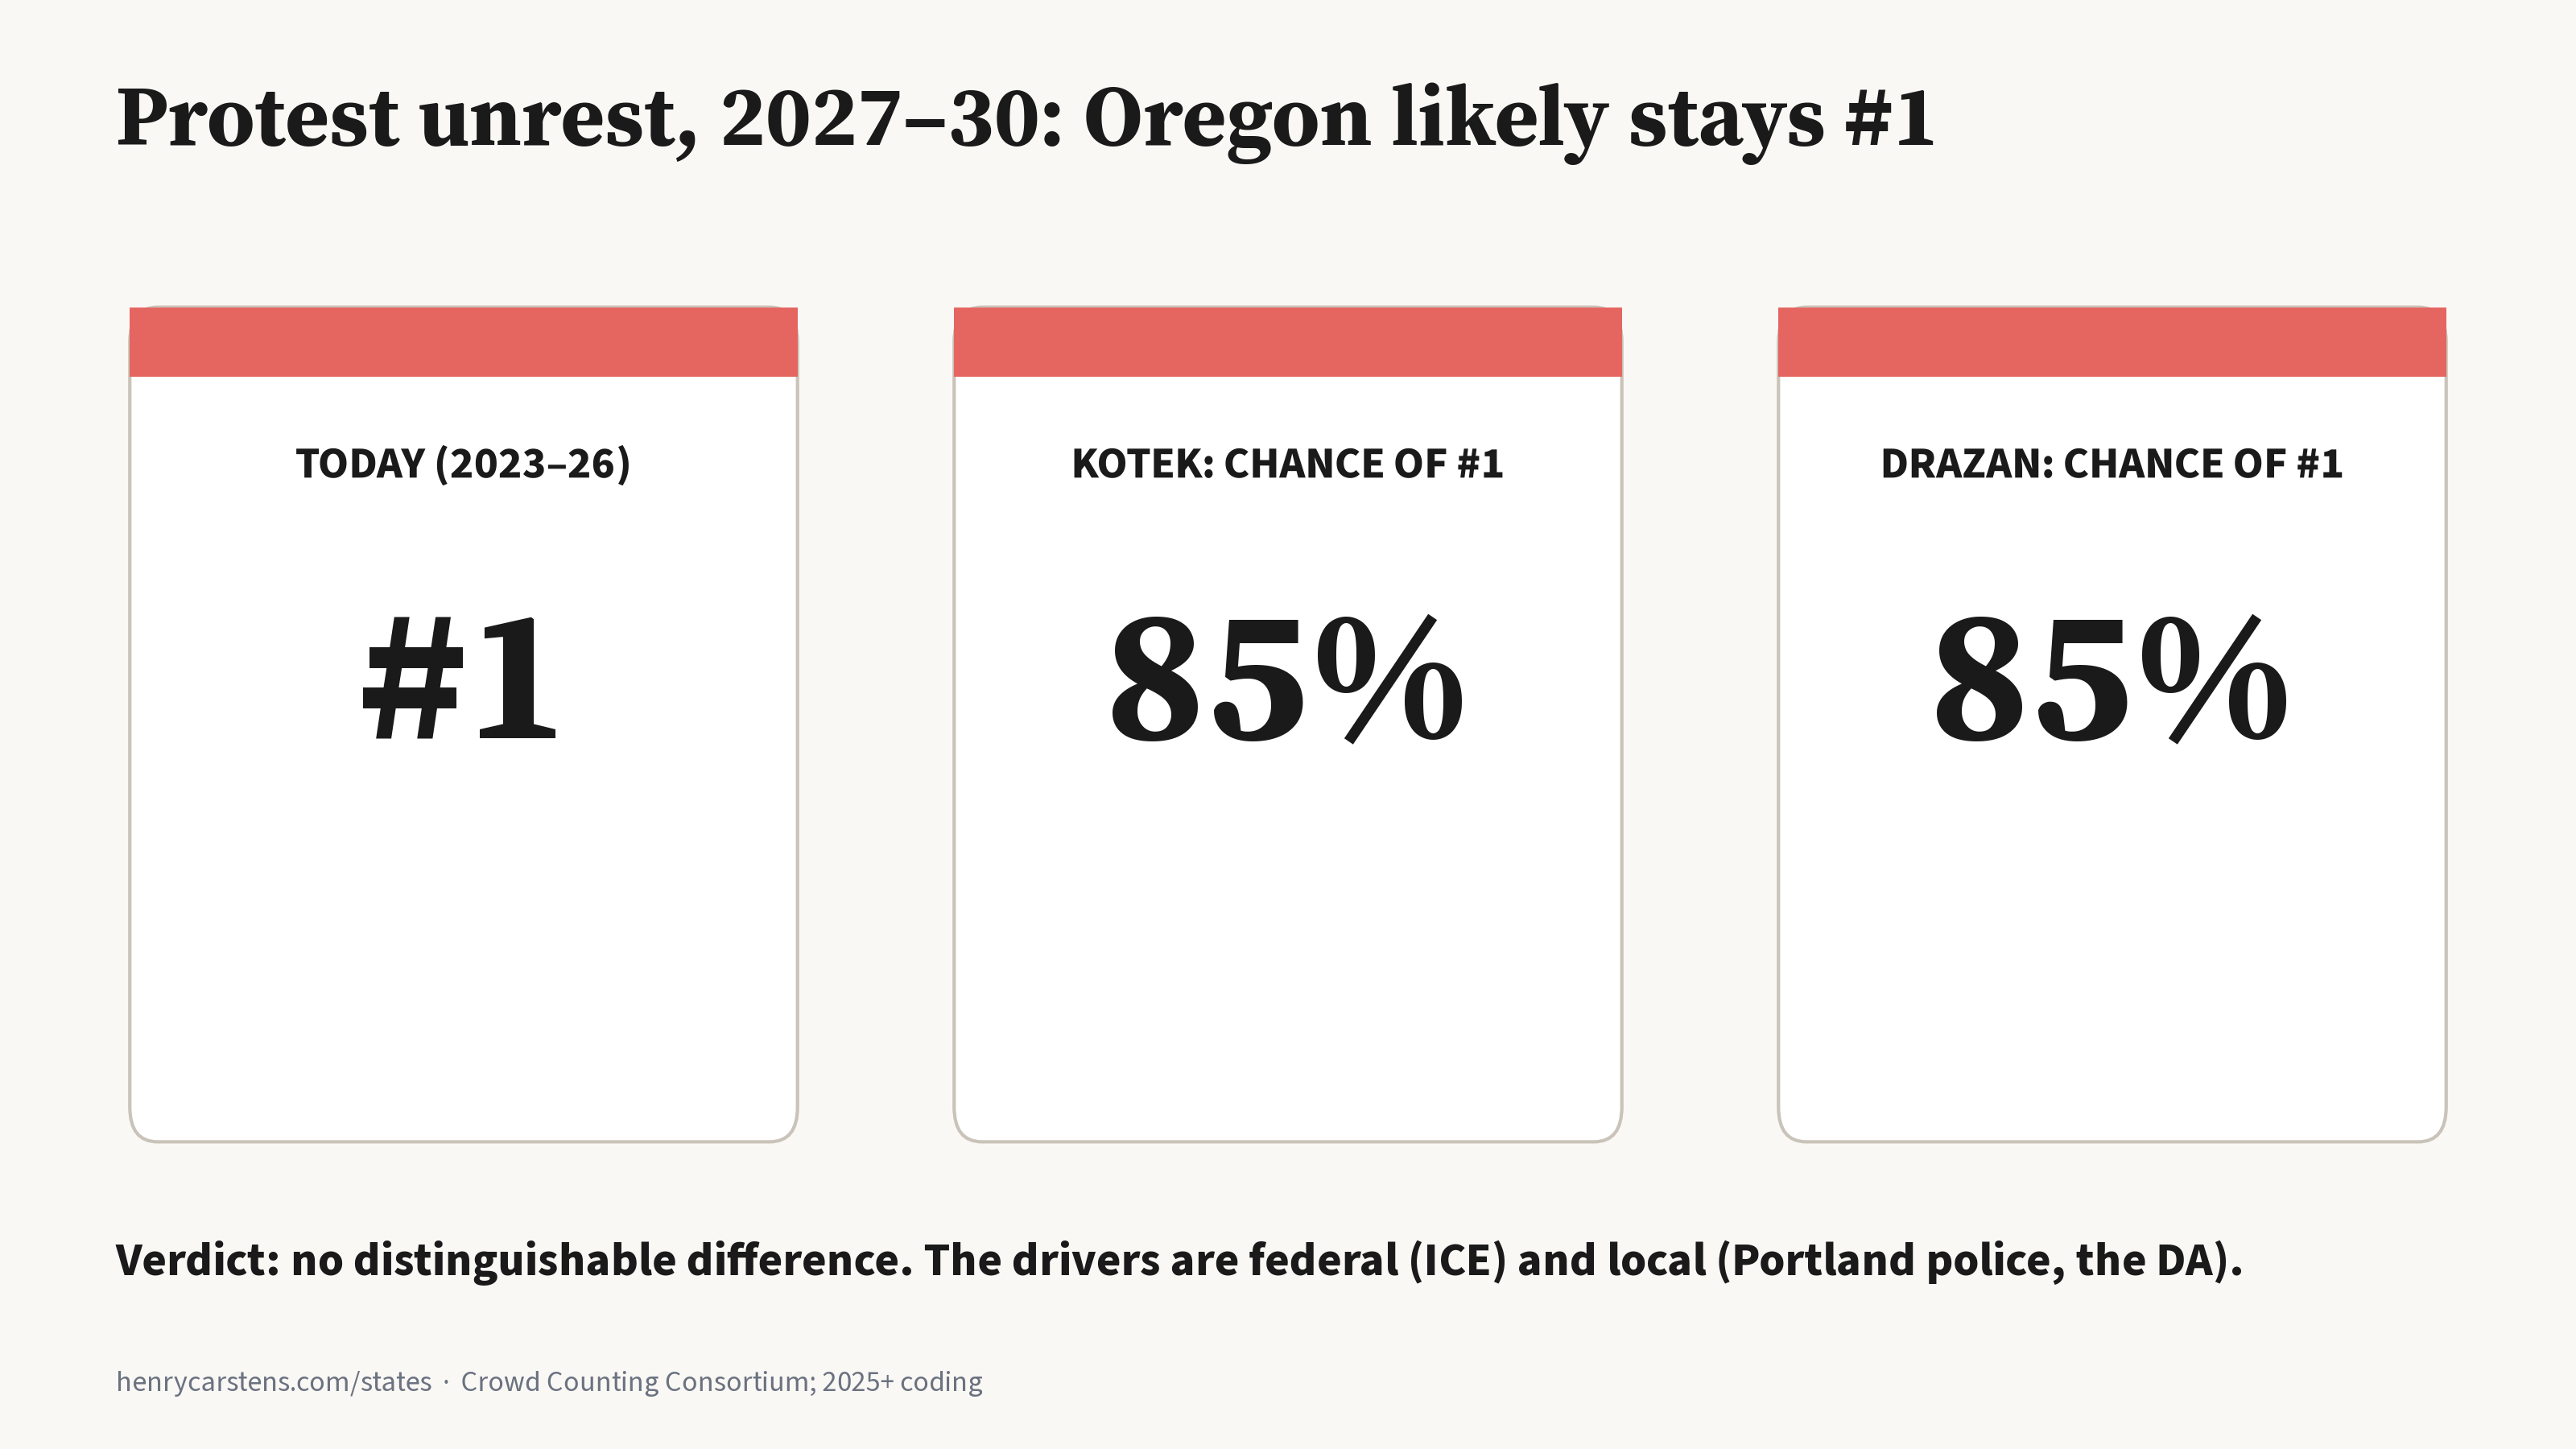
Bottom line: Oregon probably keeps the top spot in protests with reported injury or property damage. I put the chance at about 85% for 2027–30, under either governor. The Kotek–Drazan gap is about 0.2% of Oregon's rate, against noise of −31% to +43%. No distinguishable difference. What drives this number is federal (immigration enforcement, the 2028 election) and local (Portland police and the Multnomah DA), not Salem.
Where it stands. My unrest article found Oregon averaged 0.90 such events per 100,000 residents a year from 2020 to 2025, 3.4 times the next state (Crowd Counting Consortium data). Year by year it has fallen fast: 2.66 (2020), 1.29, 0.40, 0.31, 0.54 (2024), 0.21 (2025). In 2025 the data changed how it codes property damage, so 2025 onward isn't comparable with earlier years. Oregon was #1 in four of those six years, and 2nd in 2023 (Rhode Island) and 2024 (New York). On the same coding, January–May 2026 runs at 0.34 a year, 3rd behind Minnesota (the Minneapolis immigration surge) and tiny Vermont. Oregon has been #1 in every four-year window since 2020, but its lead is shrinking. In 2020–23 it was 4.2 times the runner-up; in 2023–26 it's 1.4 times (New York).
Shared baseline. Oregon's rate = the national level × Oregon's usual multiple. - National level: I use the 2025–26 level, on the new coding, with a bump for the 2028 election year. In the last election year, 2024, events ran 2.1 times the 2021–23 average. 2020 is left out as a one-off. - Oregon's multiple: since 2022 it has run 3.8–7.4 times the national rate. It's high because of Portland, and Portland's protest scene is old. Oregon was #1 in 2017, 2018 and 2019 too, before George Floyd. Notice that in national surge years (2020, 2024) Oregon's share falls: other places catch up. - Method: I re-ran 2027–30 20,000 times, each year drawing one of the 2022–26 state patterns, then adding random counting noise. - Result: Oregon averages about 0.29 per 100,000 a year (80% range 0.20–0.41), about 12 events a year. That's on the new coding; on the old coding the number would be higher.
Without Portland, the "49th of 50" claim (2nd-most) likely doesn't survive. In 2023–25, the rest of Oregon ran only 1.2–1.4 times the national rate. My central rank for Oregon-minus-Portland in 2027–30 is about 7th-most, with a 4% chance of 2nd. The 2020–21 years carried that line in the article.
The candidate levers. Same method as above: effect = chance × size from a named source. Neither governor controls the main drivers. - National Guard / federal surge at the Portland ICE facility. This is a federal decision. Trump's attempt to federalize the Oregon Guard in fall 2025 was blocked. Judge Immergut's November 2025 injunction stands after the government dropped its appeal (Ninth Circuit, Feb. 17, 2026), following the Supreme Court's denial of a stay in Trump v. Illinois (Dec. 23, 2025). Kotek fought it in court. Drazan says "I don't want National Guard troops in Oregon" (OregonLive, Oct. 2026), though her Sept. 27, 2025 statement blamed "state and local leaders" and did not oppose the move. The attorney general and the City of Portland can sue regardless of the governor. I give a 10% (Kotek) vs 12% (Drazan) chance of a new surge in 2027–28, lasting 2–4 months. That's my judgment. - Size: ACLED found Oregon's share of violent demonstrations rose from under 17% to over 42% after federal agents arrived in July 2020. But that's before vs. after, and Crowd Counting Consortium counts for the same weeks show fewer Portland injury/damage events per day (0.64 → 0.46). In 2025, through the ICE protests and the Guard fight, the rate stayed flat at about 0.02 a day. I use 0.7 to 2.5 times the rate during an episode. - State Police sent to Portland. Drazan would more likely do it ("fully fund the State Police," "Oregon should enforce our own laws"): 50% vs 20%, my judgment. The one test case is the State Police fortnight of July 30–Aug. 13, 2020, which ran 0.73 events a day vs 0.46 before. That's 15 days, and troopers left when the DA stopped charging protest cases. Crowd research (Stott & Reicher) says heavy-handed policing can escalate as easily as it deters. I use 0.6 to 1.6 times for 1–3 months. - Prosecution: not a governor lever. DA Nathan Vasquez ended his predecessor's protest-decline policy in January 2025 and charged 33 of 37 Portland police protest arrests in 2025, as of October (OPB, Oct. 8, 2025). His term runs to January 2029. - City control: the Portland Police Bureau answers to the mayor and the new city council, not the governor.
Netted, the levers move Oregon's 2027–30 rate by about +0.5% under Kotek and +0.7% under Drazan. The gap between them is −4% to +2% (99% range). The noise band is −31% to +43%. The chance of #1 is about 85% under both (84.8% Kotek, 85.1% Drazan). No distinguishable difference.
Cause or correlation?
- Federal enforcement → protest volume: probably causal. Oregon protests mentioning ICE or immigration (my keyword search of the data) went from 1 in 2024 to 132 in 2025 and 420 in January–May 2026. That followed a federal decision Oregon didn't control, and the timing is sharp.
- Federal enforcement → injury/damage events: not shown. The two datasets disagree on 2020 (ACLED up, the Crowd Counting Consortium down). In 2025–26 the Consortium shows no rise, partly because of its new coding. Before/after comparisons can't separate the deployment from everything else going on.
- Policing and prosecution → violence: not shown. The 2020 State Police and DA-policy windows are a few weeks long, overlap each other, and come during a national decline.
- Urban share → unrest (ρ = 0.34 across states): correlation only.
- Unrest → Safety rank: no link (ρ = −0.06).
- Unrest → economy: my Portland synthetic-control work puts unrest at most at the 10–15% hospitality-specific part of the 2025 shortfall, as an upper bound. No one has a clean causal estimate.
Signposts: whether a federal enforcement surge returns to Portland (the main swing factor until Jan. 2029); the size of the 2028 election-year national bump; and whether New York or Minnesota stay within 1.5 times of Oregon.
What would make this wrong: another coding change in the data; a single long confrontation (like 2020) that dwarfs everything; or Portland's protest scene fading. If Oregon stays at its quietest multiple (2023–24), the chance of #1 falls to about 47% (47.4% Kotek, 47.1% Drazan).
Signposts to watch
-
Oregon's 2025 property crime vs. the U.S. (state tables, fall 2026). If Oregon fell faster than the nation, 37th becomes a ceiling, not a floor.
-
Sworn State Police officers in the 2027–29 budget. Under 300 added means the lever stays in the rounding.
- Portland property crime and arrest rates (clearances). That's where most of the state's property crime is.
What would make this wrong
- A big local change in Portland, such as a large police hiring push or new prosecution policy. That could move the rank more than any governor. Credit (or blame) would belong to the city.
- The national crime drop reversing. That moves Oregon along with everyone, not relative to them.
- FBI reporting coverage. If big agencies miss a year of reporting, ranks jump for data reasons. I adjust for coverage, but it's imperfect.
- My police and treatment sizes. If Drazan funds 500 troopers, the lever is still worth only about half a place.
Sources: FBI Crime in the Nation 2024 (site panel) and the 2025 national release (Aug. 14, 2026); states-formula backtest; Chalfin & McCrary 2018, REStat 100(1); Bondurant, Lindo & Swensen 2018, JUE 104; National Research Council 2014; Leigh 2008; Dynes & Holbein 2020; Crowd Counting Consortium (Harvard Dataverse) phases 1–3 through May 2026; ACLED, Demonstrations and Political Violence in America: New Data for Summer 2020; Ninth Circuit orders 25-6268/25-7194 (Jan. 8, 2026) and Oregon Capital Chronicle (Feb. 17, 2026); OregonLive (Oct. 2026, Drazan on troops; Jan. 2025, Vasquez policy); OPB (Oct. 8, 2025); AP and OregonLive (Aug. 2020, State Police exit); Drazan press release (Sept. 27, 2025); FBI LEOKA 2024 via policecensus.com (compiled); OLIS HB 4002 (2024); The Drazan Plan; Kotek 2026 platform PDF; site unrest analysis.
Oregon in Four Years
- Oregon in Four Years, Part 1: Jobs. Who Wins Matters Less Than You Think
- Oregon in Four Years, Part 2: Safety. The Gap Is a Rounding Error (this page)
- Oregon in Four Years, Part 3: Schools. The Test Comes Too Soon
- Oregon in Four Years, Part 4: Will You Be Better Off?
- Oregon in Four Years, Part 5: What It Would Take
- Opinion: What Would Make This Election Matter to the Middle of Oregon
- Oregon Spent 89% More on Schools. Scores Fell to 45th.
--h
Questions or corrections? Write me at .