Oregon in Four Years · Part 5
Oregon in Four Years, Part 5: What It Would Take
The governor's race barely moves Oregon's ranks, but someone can. Most of the levers sit with the Legislature, city halls, county DAs and sheriffs, school boards, and voters. Schools is the only pillar where a real gain by 2030 is realistic: 2–7 places.
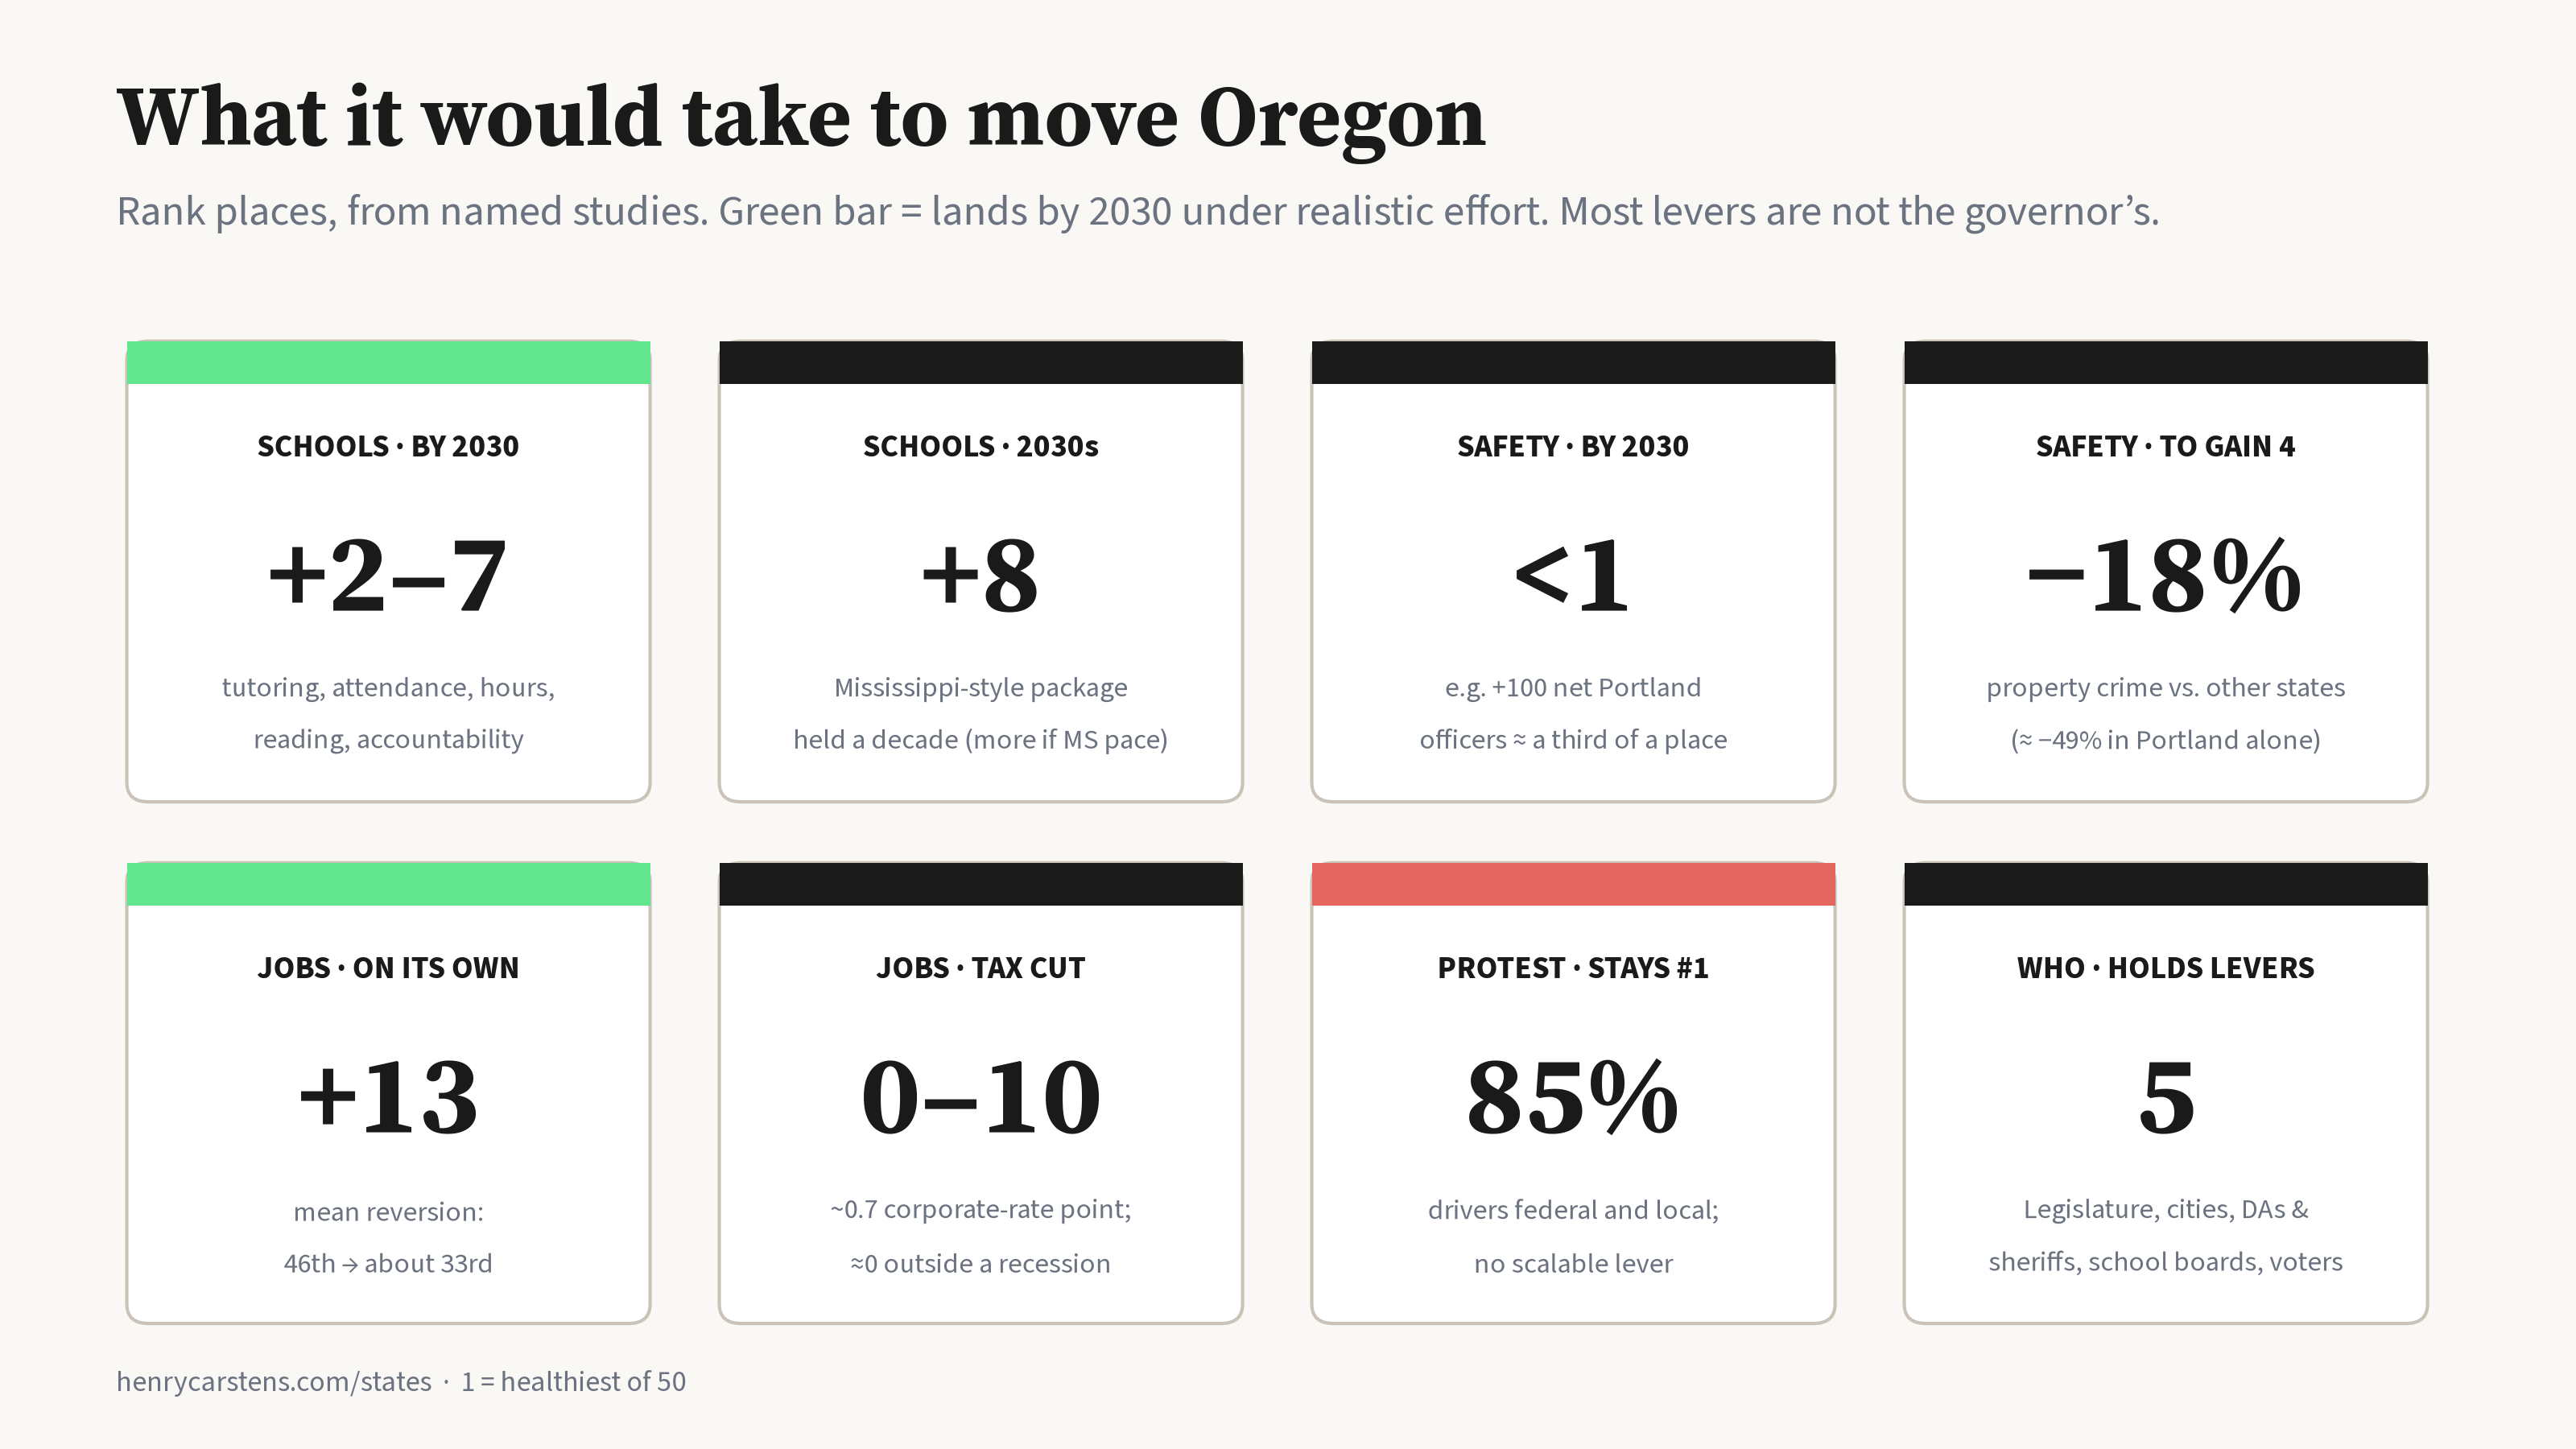
Bottom line: The governor's race barely moves Oregon's ranks, but someone can. Most of the levers sit with the Legislature, city halls, county DAs and sheriffs, school boards, and voters. Schools is the only pillar where a real gain by 2030 is realistic: 2–7 places.:
- Schools is the only pillar where a real gain by the 2030 test is realistic: 2–7 places if tutoring, attendance, more school hours and a reading push all start in 2027. Money with no strings has the weakest record in Oregon: spending rose 89% since 2013 (5th fastest) while scores fell faster than in 45 other states. So repurpose, don't add: shift about $216–364M a year from overhead into classrooms to pay for those levers.
- Safety needs far more than anyone proposes. Under 1 place is realistic by 2030.
- Jobs is already likely to climb about 13 places through mean reversion. Beyond that, the levers are small or unproven.
Most of the big gains are 2030s payoffs.
I sized each move the same way as the rest of the series. I take a named study's effect, convert it to Oregon's rank with the other 49 states held where they are in 2024, and say how long it takes. Where I had to assume something, I say so.
Who holds the levers, 2027–30
| Who | When they decide | What they control |
|---|---|---|
| Legislature | 2027 long session (up to 160 days), 2028 short session (35), 2029 long session | Two-year budgets, including the State School Fund. Raising taxes needs three-fifths of each chamber (Art. IV §25); cutting them needs a simple majority. Overriding a veto needs two-thirds (Art. V §15b). Measures sent to voters can't be vetoed (Art. IV §1(3)(c)). |
| Mayors and city councils | Annual budgets (July 1) | Police staffing, permitting, downtown. Portland: 820 sworn officers vs 877 authorized (and 1,001 authorized in 2019). The bureau's goal is to hire about 100 a year for a net gain of 25 (PPB staffing page, Oct 9, 2026; FY2025–26 budget). |
| County DAs and sheriffs | Ongoing; Multnomah DA term runs to January 2029 | Which cases get charged, and jail beds. The evidence favors certainty of being caught over longer sentences (Nagin 2013, Crime and Justice 42; National Research Council 2014). |
| School boards and superintendents | Annually; boards are elected in May of odd years (ORS 255.335) | Curriculum (science of reading), tutoring, attendance pushes, school calendars. |
| Voters | Nov 2028 ballot | Initiatives need signatures equal to 6% (a law) or 8% (a constitutional amendment) of the last governor's-race vote (Art. IV §1(2)). Oregon voters decriminalized drugs in 2020 (Measure 110); the Legislature reversed much of it in 2024 (HB 4002). |
| Governor | Budget proposal; appointments; executive orders | Agenda-setting, the education department's priorities, State Police, vetoes. As Parts 1–4 showed, this moves the ranks very little in four years. |
Schools (now 45th): the best odds of a real gain, but not from money alone
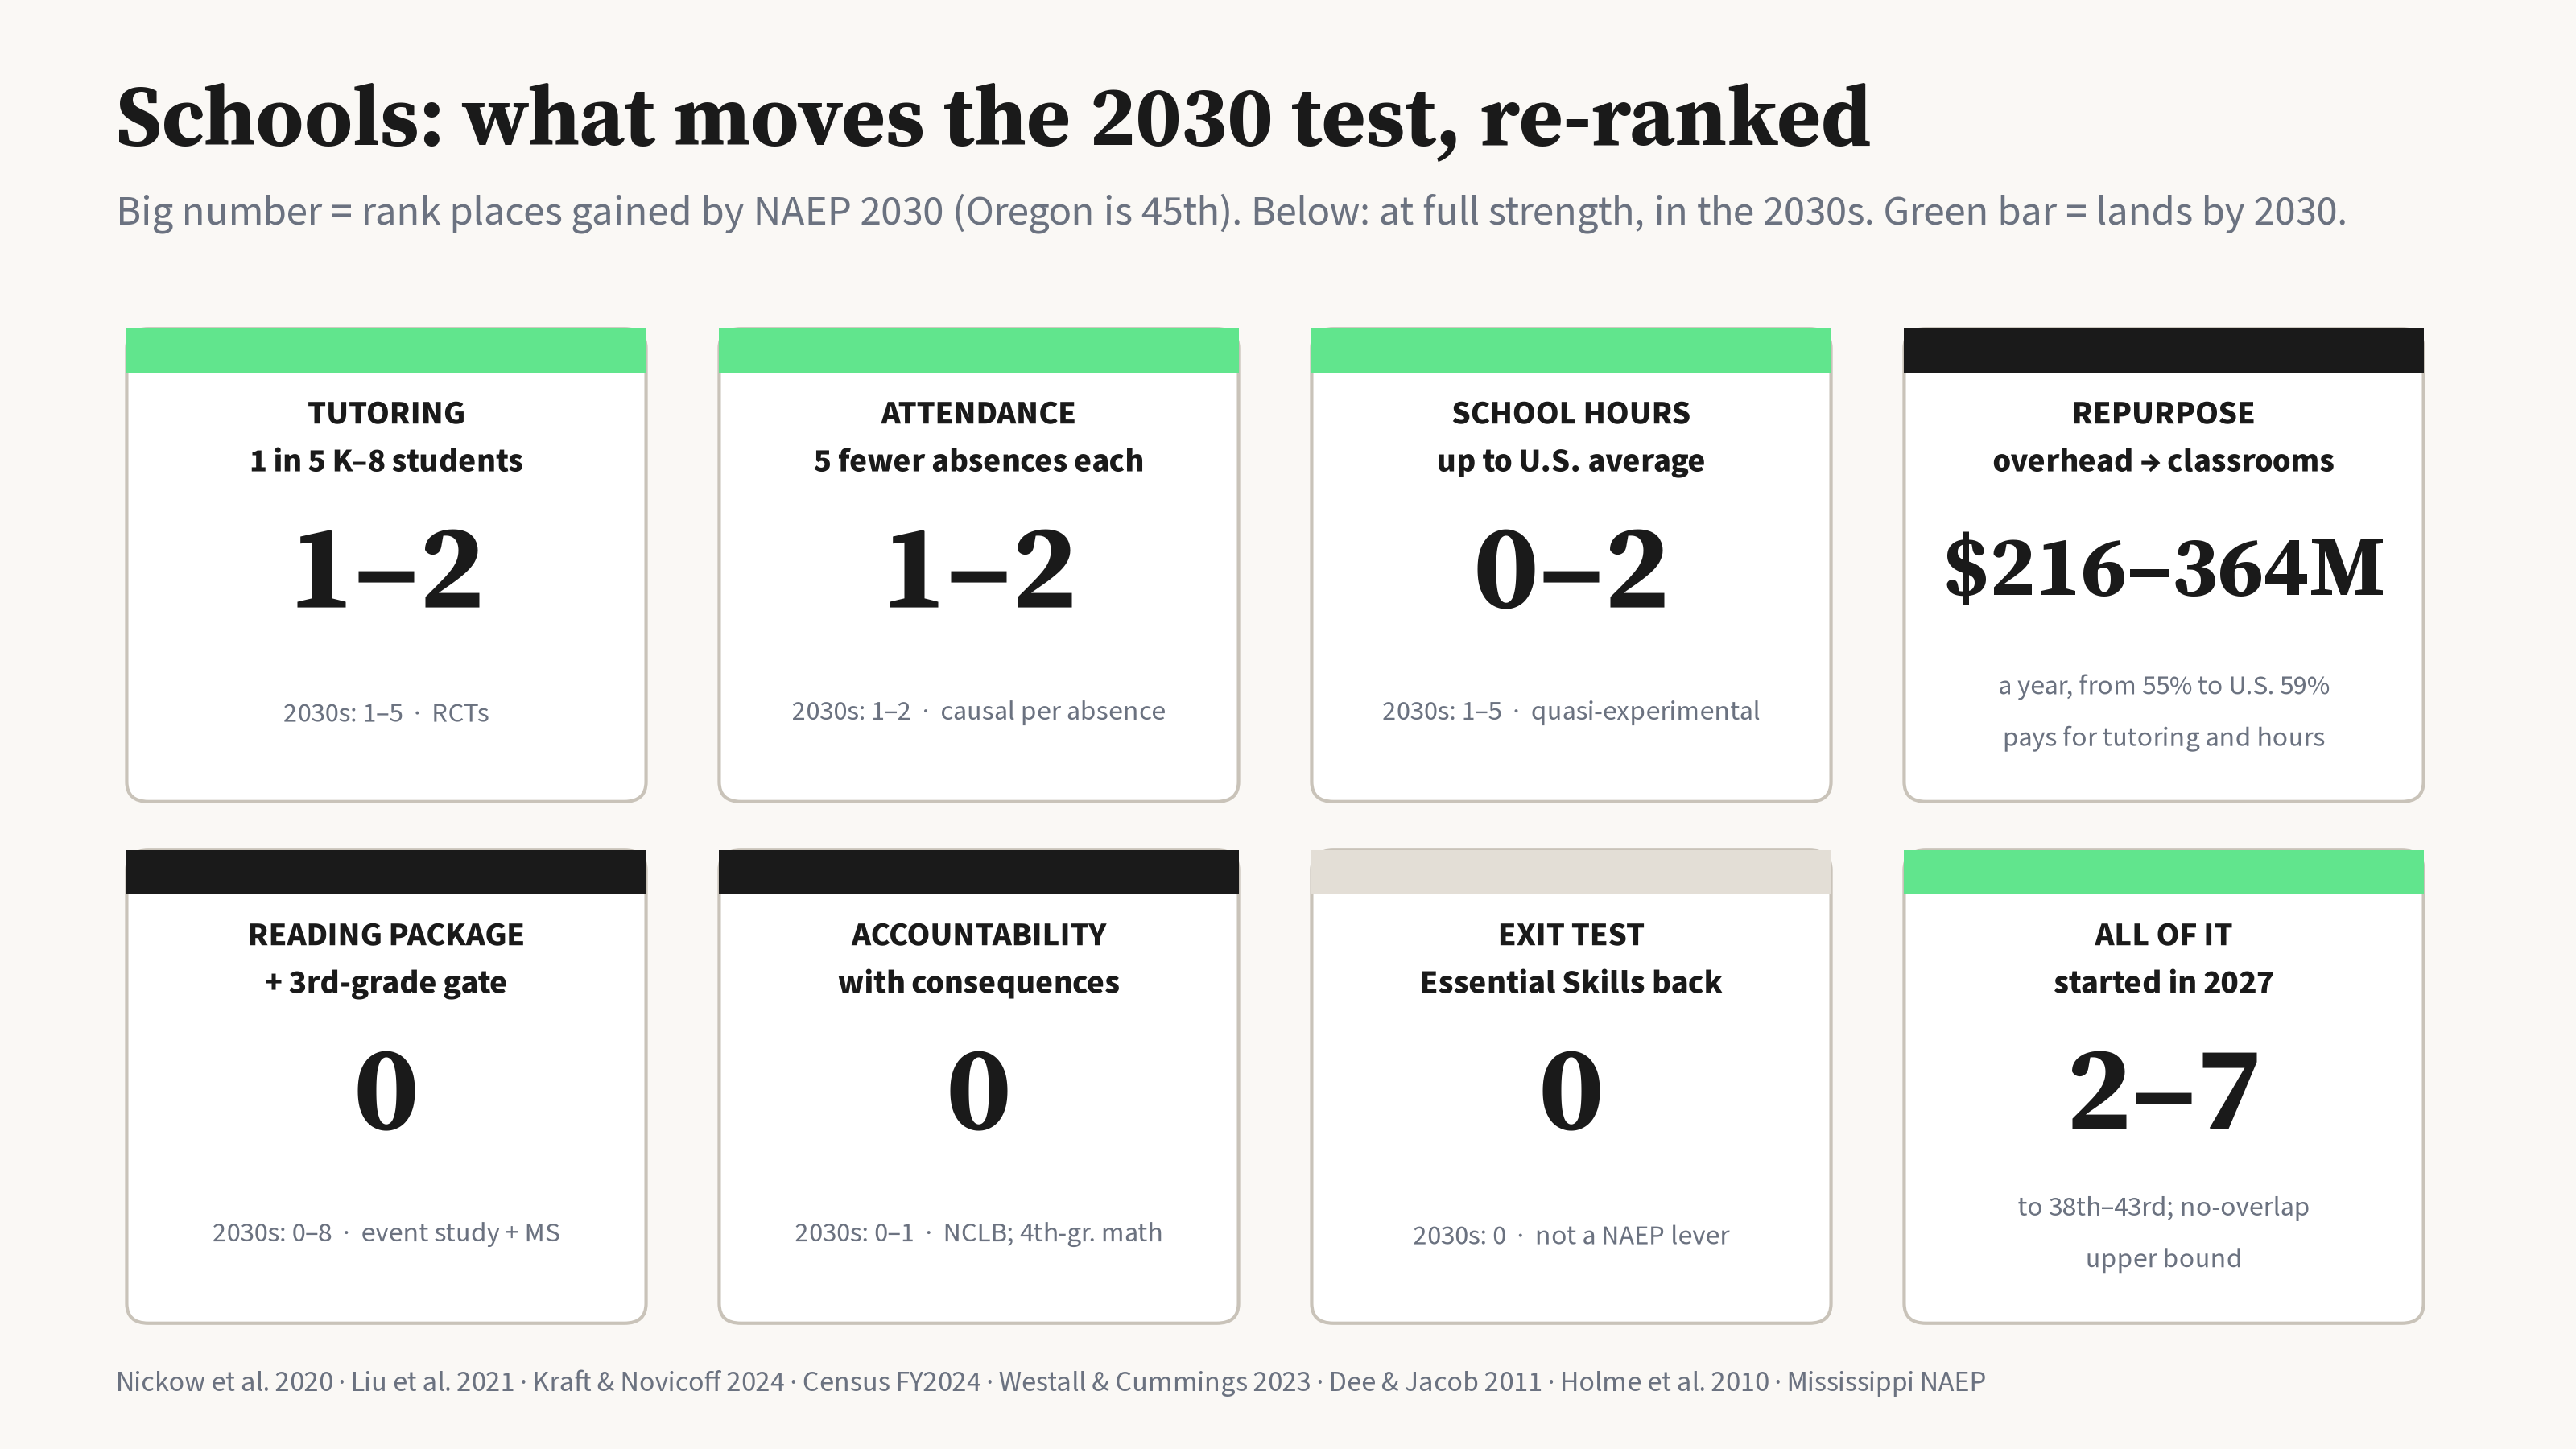
Scale: +1 NAEP point on all four tests is worth about 2.5 places. A gain on one test (say, 4th-grade reading) counts for about a quarter of that. NAEP 2030 is the last test in the term.
Why the re-rank. Oregon now spends a bit more than the average state: $18,083 per pupil in FY2024, 19th of 50 (23rd after living costs). Spending grew 89% from FY2013, the 5th-fastest rise, and scores fell 13.2 points against a national 8.4. Only 55% of the money goes to instruction (59% nationally), and benefits take 29% (24% nationally). Sources: Census Annual Survey of School System Finances; NAEP. Money still helps on average in the causal studies (Jackson & Mackevicius 2024), so I don't zero it out. But here, the case for what the money buys is far stronger than for the money itself. The full test of the "it's not the money, it's the focus and accountability" pushback is in Part 3.
| Rank | Move | Who | Effect (source) | Places by NAEP 2030 | Full strength (2030s) | Lag |
|---|---|---|---|---|---|---|
| 1 | High-dosage tutoring, 1 in 5 K–8 students | School boards, districts; Legislature (literacy money) | +0.37 SD in trials (Nickow, Oreopoulos & Quan 2020); I assume +0.10–0.20 at scale | 1–2 | 1–5 | 1–2 school years |
| 2 | 5 fewer absences per student (33.5% chronically absent; 4th-worst in 2023, AEI) | Superintendents, principals, families | 10 absences = −0.03 to −0.04 SD (Liu, Lee & Gershenson 2021) | 1–2 | 1–2 | Same year, if absences fall. No policy has proven it can do this statewide |
| 3 | School hours up to the U.S. average (Oregon 47th; 900 hours K–8, OAR 581-022-2320) | State Board (the rule), Legislature (money), district bargaining | Under 0.05 SD for 10% more time (Kraft & Novicoff 2024) | 0–2 | 1–5 | Bargaining plus phase-in |
| 4 | Repurpose, don't add: shift $216–364M a year from overhead into classrooms (55% → U.S. 59%) | Legislature, school boards, bargaining | Pays for levers 1–3; not scored on its own (Census FY2024) | — | — | Budget cycles and bargaining |
| 5 | A full science-of-reading package with a 3rd-grade gate | Legislature (the gate), State Board (approved curricula), districts | Comprehensive state policies: +0.03 to +0.10 SD in 4th-grade reading (Westall & Cummings 2023). Mississippi: retained students +1.2 SD in 6th-grade reading (Slungaard Mumma & Winters 2023) | 0 | 0–8 (the 8 at Mississippi's pace) | The gate first binds in spring 2029; the full effect needs a kindergarten cohort: a 2030s payoff |
| 6 | Accountability with consequences | Legislature, State Board, ODE | NCLB: +7.2 points in 4th-grade math, none in reading (Dee & Jacob 2011); I assume 25–50% of that for Oregon | 0 | 0–1 | SB 141's consequences start in 2028–29, and fund control comes after 4 missed years |
| 7 | Restoring the Essential Skills exit test | State Board, Legislature | Exit exams cut graduation and do little for achievement (Holme et al. 2010) | 0 | 0 | — |
Realistic by NAEP 2030: levers 1, 2, 3, 5 and 6, all started in 2027, would gain 2 to 7 places (to about 38th–43rd). The upper end assumes their effects don't overlap. 2030s: a Mississippi-style package (a reading law, coaches, a 3rd-grade gate and accountability, held for a decade) is worth at least 8 places at my conservative +4 points. Mississippi itself gained 9.4 points more than the average state across the four tests from 2013 to 2019, and went from 50th to 38th in six years and 26th by 2024. Some of a gate's gain is mechanical, because held-back students aren't in the 4th-grade test pool. Hypothesis check: the evidence supports "reading, time, attendance and accountability over raw money." It doesn't yet support blaming the decline on curriculum content, because nobody has measured that.
Safety (now 37th): bigger than anyone proposes
Scale: each 1% cut in property crime is worth about 0.3 places; each 1% cut in violent crime about 0.15. Property crime (47th) is the drag.
| Move | Who | Effect (source) | Places | Lag |
|---|---|---|---|---|
| Portland hires 300 more officers (820 → 1,120, +37%) | Mayor and council | Police elasticity −0.17 property, −0.34 violent (Chalfin & McCrary 2018). Portland is about 37% of Oregon's property crime (my estimate from PPB's 2024 counts and FBI totals). | about 1 | ~12 years at the current net +25 a year; ~$65M a year at about $216k per officer, fully loaded (my estimate from the PPB budget) |
| Cut property crime 18% faster than other states | Cities, DAs, sheriffs together | Arithmetic on the 2024 FBI ranks | 4 | No proven four-year path. In Portland alone it would take about a 49% cut |
| Statewide police up 57% (about 3,200 more officers) | Every city and county | Chalfin & McCrary 2018 | 4 | Not realistic; roughly $690M a year (my estimate) |
| Swift, certain arrests and charges for repeat property offenders | DAs, police | Certainty deters more than severity (Nagin 2013), but there's no state-level effect size | not counted | 1–3 years |
Realistic by the 2029 data: under 1 place. For example, a net +100 Portland officers is worth about a third of a place. Oregon's property crime fell 18.9% from 2022 to 2024 and the state stayed 47th, because everyone else fell too. Gaining here means beating a national decline, which is a 2030s project.
Jobs (now 46th): mean reversion does most of the work
Scale: each 0.035-point rise in the net business-opening rate is worth about 1 place. The baseline already expects Oregon to reach about 33rd by the 2029 data.
| Move | Who | Effect (source) | Places | Lag |
|---|---|---|---|---|
| A business tax cut worth about 0.7 of a corporate-rate point | Legislature (simple majority) | About 0.5% more business locations per point (Giroud & Rauh 2019, upper end). But Ljungqvist & Smolyansky find cuts outside recessions do little. | 0–10 | 1–2 years |
| More newcomers: +1 net domestic migrant per 1,000 residents a year (about 4,300 people) | Cities and counties (housing), Legislature (land use) | +0.7 on the Jobs score the next year (site formula). That's a forecasting link, not a proven cause. | small, but it compounds | Oregon went from +5.9 per 1,000 (2019) to −1.9 (2023) |
| Faster permits, ready land, recruiting | Cities, the state | No measured statewide effect; incentives tip 2–25% of location choices (Bartik 2018) | not counted | 2+ years |
Realistic by the 2029 data: the climb to the low 30s mostly happens on its own. A recession is the one case where a tax cut does measurably help. The migration link is the one to watch. The site's own housing work found no proof that permits drive it.
Protest unrest: mostly out of state hands
The drivers are federal (immigration enforcement, the 2028 election) and local (Portland police crowd tactics, the Multnomah DA's charging). Neither has a named effect size I can scale. Realistic in 4 years: Oregon likely stays #1 (about 85%) unless Portland's protest scene fades.
What's realistic, and what's a 2030s payoff
- By 2030 (realistic): Schools up 2–7 places if districts deliver tutoring, attendance and more hours, and the Legislature and State Board start a reading package with real accountability. Pay for it by repurposing overhead, not adding money. Jobs to about 33rd on its own. Safety flat.
- 2030s: a Mississippi-style reading package (about 8 places), a rebuilt Portland police force (about 1 place), beating the national crime decline (4+ places), and any lasting Jobs gain from migration.
- The common thread: the biggest levers need several governors, mayors and school boards in a row to stick with them. That's the lesson of Mississippi and of my "bottom-10 clock": 7–13 years for the big climbs.
Sources: Census Annual Survey of School System Finances FY2013/FY2024; Urban Institute adjusted NAEP 2024; Westall & Cummings 2023 (EdWorkingPaper 23-788); Slungaard Mumma & Winters 2023; Dee & Jacob 2011, JPAM 30(3); Holme et al. 2010; AEI Return to Learn (Malkus 2025); OAR 581-022-2320; SB 141 (2025); Jackson & Mackevicius 2024, AEJ: Applied 16(1); Nickow, Oreopoulos & Quan 2020, NBER w27476; Liu, Lee & Gershenson 2021, J. Public Econ. 199; Kraft & Novicoff 2024, AERJ 61(4); Chalfin & McCrary 2018, REStat 100(1); Nagin 2013, Crime and Justice 42; National Research Council 2014; Giroud & Rauh 2019, JPE; Ljungqvist & Smolyansky (NBER w20753); Bartik 2018 (Upjohn); PPB staffing dashboard (Oct 9, 2026), FY2025–26 budget summary, and 2025 annual report; ODE At-a-Glance 2024–25; FBI 2024 (site panel); NAEP (site panel); Oregon Constitution; States formula card.
Oregon in Four Years
- Oregon in Four Years, Part 1: Jobs. Who Wins Matters Less Than You Think
- Oregon in Four Years, Part 2: Safety. The Gap Is a Rounding Error
- Oregon in Four Years, Part 3: Schools. The Test Comes Too Soon
- Oregon in Four Years, Part 4: Will You Be Better Off?
- Oregon in Four Years, Part 5: What It Would Take (this page)
- Opinion: What Would Make This Election Matter to the Middle of Oregon
- Oregon Spent 89% More on Schools. Scores Fell to 45th.
--h
Questions or corrections? Write me at .